Economy of the republic of IrelAnd
1.
Overview
2.
Principal economic results of Census 2002
3.
Cost of Living
4.
Money
Overview
Ireland is a strategic location on major air and sea
routes between North America and northern Europe. The Irish economy grew
very rapidly in the early 1990s and Ireland came to be dubbed the "Celtic
Tiger". After almost a decade of record growth, the Irish economy
decelerated onto a slower and more stable growth pattern in 2001/2002. For
most of the 1990's the Irish economy was expanding at three times the EU
average.The key factors in Ireland's economic achievements in the 1990's
were the following:
1. A youthful population and rapidly expanding labour
supply: Ireland's population has been steadily increasing since the 1970's.
The population grew at an annual rate of 1.3% from 1996 to 2002, the highest
rate of growth in the EU.
2. Substantial inward investment
inflows.
3. The strategic deployment of EU Structural and Cohesion
Funds;In 1999 Ireland marked 25 years of full membership of the EU. Since
accession, per capita GDP in Ireland has increased from almost 60% of the EU
average in 1973 to well over 100% today. The country continuously reducing its
economic dependence on the UK. Since 1973, the proportion of exports to non-UK
destinations has increased from 45% to 74% today.
4. Pursuit of pragmatic and innovative government policies.
5. A Social Partnership approach to economic development.
6. An openness to international trade in goods and
services, and to new ideas. There are over 1,100
overseas-owned companies in Ireland. Nearly half of these are from the United
States and companies from Germany and the United Kingdom comprise roughly
another quarter. Overseas-owned companies employ about 133,000 people.
7. An emphasis on education and technological innovation.
Agriculture, once the most important sector, is now dwarfed
by industry and services. Industry accounts for 46% of GDP, about 80% of
exports, and 29% of the labor force. Although exports remain the primary engine
for Ireland's growth, the economy has also benefited from a rise in consumer
spending, construction, and business investment. Per capita GDP is 10% above
that of the four big European economies and the second highest in the EU behind
Luxembourg. Over the past decade, the Irish Government has implemented a series
of national economic programs designed to curb price and wage inflation, reduce
government spending, increase labor force skills, and promote foreign
investment. Ireland joined in circulating the euro on 1 January 2002 along with
11 other EU nations.
The agri-food industry is an important sector of the Irish economy. It accounts
for over 8 per cent of GDP, 7.5 per cent of total employment and, including food
and agricultural products, around 7 per cent of exports. 70% ff the total land
area are utilised for agricultural purposes (including forestry). Cattle-raising and dairying are by far the most important sectors of the
agricultural industry, and livestock (mainly cattle) and livestock products
(principally milk), account for 76 per cent of the value of gross agricultural
output. The Irish Sea fishing industry also makes a significant contribution to
the economy, in terms of output, employment and exports.
The industrial sector has a highly skilled labour pool. Within this high
technology grouping, the most active sectors currently are life sciences and
medical technology sectors. There is also considerable consolidation in the
information technology sector. There has been an impressive performance from all
the world-leading companies in Ireland by comparison with other EU countries.
The service sector in Ireland accounts for over half of GDP and for 64 per cent
of employment. Throughout the last decade output of services has grown strongly,
largely as a result of growth in financial services, telecommunications and
tourism.
|
GDP:
|
€107.8
billion (2005 est.)
( €126 billion)
 |
|
GDP growth rate:
|
4.9% (
3.9%)
(2005 est.) |
|
Gross monthly earnings:
|
€2500
(
€620) |
|
GDP - composition by sector:
|
agriculture: 5% (
3.9%)
industry: 46% ( 30.9%)
services: 49% (
65.3%) (2002 est.) |
|
Labor force - by occupation:
|
agriculture 8%, industry 29%, services 64% (2002 est.) |
|
Unemployment rate:
|
4.2% (2005
est.)
(
7.1%) |
|
Inflation rate (consumer prices):
|
2.7% (2005
est.)
(
3.7%) |
|
Population below poverty line:
|
10% (2003
est.)
(
8.6%) |
|
Budget:
|
revenues: €55.5 billion
expenditures: €54.6
billion (2005 est.) |
|
Agriculture - products:
|
turnips,
barley, potatoes, sugar beets, wheat; beef, dairy products |
|
Industries:
|
steel, lead, zinc, silver, aluminum,
barite, and gypsum mining processing; food products, brewing, textiles,
clothing; chemicals, pharmaceuticals; machinery, rail transportation
equipment, passenger and commercial vehicles, ship construction and
refurbishment; glass and crystal; software, tourism |
|
Exports:
|
€80.3
billion (2005 est.) |
|
Exports - partners:
|
US 19.7%,
UK 17.7%, Belgium 14.7%, Germany 7.7%, France 6%, Netherlands 4.6%, Italy
4.5% (2004) |
|
Imports:
|
€51.6
billion (2005 est.) |
|
Imports - partners:
|
UK 35.7%,
US 13.8%, Germany 9%, Netherlands 4.3%, France 4.2% (2004) |
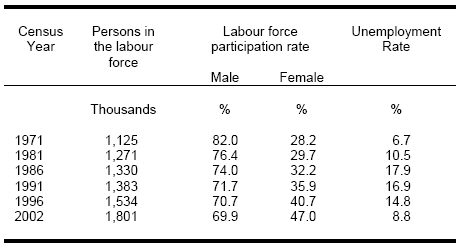
Principal economic results of Census 2002
The growth in the labour force recorded in recent censuses is largely due to a
combination of the underlying growth in the population aged 15 years and over
and increasing female labour force participation; the latter increased from 28.2
per cent in 1971 to 47 per cent in 2002. The unemployment rate increased sharply
from 6.7 per cent in 1971 to 17.9 per cent in 1986. Following gradual decreases
in the period to 1996, it declined to 8.8 per cent by April 2002, and to below 5
per cent since then.
Main labour market
indicators, 1971- 2002
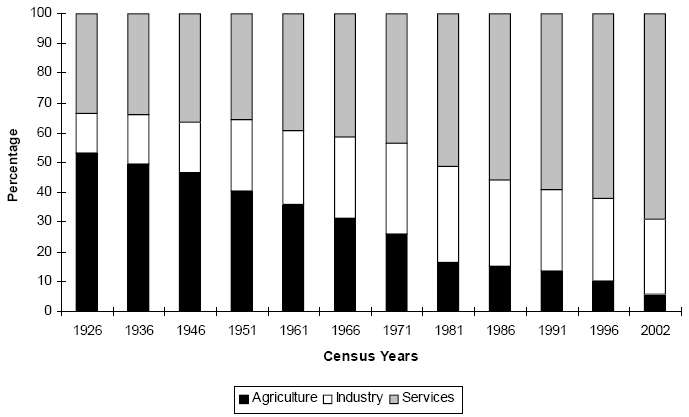
Major changes have taken place since 1926 in the relative employment shares of
the three broad sectors of economic activity: Agriculture, Industry and
Services. The diminishing importance of Agriculture is clearly evident from
Figure below with the sector accounting for a reduced share of just under 6 per
cent of total employment in 2002 compared with over 50 per cent in 1926. The
growth in Services sector employment has been particularly pronounced over the
entire period, particularly since 1971 (Ireland joined to the EU in 1973). Its
share now stands at 69 per cent of the total. Industry’s share of total
employment increased from 13 per cent in 1926 to 32 percent in 1981. Since then,
however, it has tended to decline and stood at 25 per cent in 2002.
Sectoral employment shares, 1926- 2002
Employees worked an average of 38 hours in the week before Census Day in 2002.
On average, male employees worked 10 hours more than their female colleagues
(42.3 hours compared with 32.3 hours). Those involved in Agriculture worked the
longest hours (55.4) followed by mining (44.2) and construction (42.9). Those
involved in the education sector had the shortest working week (29.9 hours).
Cost of living
The average salary in Ireland is more than 4 times more than in
Hungary. The minimum wage rate for an experienced
adult employee is 7.65 euro per hour (~2000 HUF/h;
~400 HUF/h in Hungary). On the other hand it is now believed that Ireland is now
one of the most expensive countries in which to live, in Europe.
1€ = 262 Ft (May, 2006)
|
|
|
|
|
|
|
|
|
|
|
|
|
|
|
|
|
|
|
|
Petrol (gasoline, 1 litre) |
|
|
|
|
|
|
|
|
|
|
|
Sandwich
(in a school canteen) |
|
|
Fish and
chips |
6.00 |
|
McDonalds
Meal |
3.00 – 5.00 |
A bus
ticket for one ride |
|
|
|
|
Theatre
Ticket |
12.00-30.00 |
*
This is a very good quality bread, not 'TESCO gazdaságos'!
Money
The Irish Punt was completely replaced by the Euro on 9 February 2002.
Before indroducing the Euro the bank notes depicted
famous historical persons of Ireland. The coins
beared images of different species of the Irish Fauna.
|
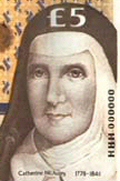 |
£5 note
features a portrait of Catherine McAuley (1778-1841), foundress of the
Sisters of Mercy. This Order has always been
associated with teaching. |
|
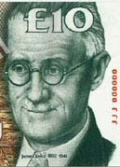 |
£10
note features a portrait of James Joyce
(1882 - 1941). He was an
expatriate Irish writer and poet,
widely considered to be one of the most influential writers of the 20th
century. |
|
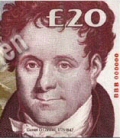 |
£20 note
carries a portrait of Daniel O'Connell
(1775-1847). Ireland's predominant politician in the
first half of the nineteenth century. He campaigned for Catholic Emancipation
and Repeal of the Union between Ireland and Great Britain. |
|
 |
£50 note
features a portrait of Douglas Hyde
(1860-1949), first President of Ireland. He founded
the Gaelic League, one of the most influential cultural organisations in
Ireland.
|
|
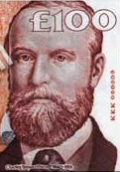 |
£100 note
features a portrait of Charles Stewart Parnell
(1846 - 1891) - the 'uncrowned King of Ireland'. He
was an Irish political leader and one of the most important figures in 19th
century Ireland and the United Kingdom. |
Today the currency in the Republic of Ireland is the Euro (EUR, €).
There are 7 euro notes. In different colours and sizes they are denominated in
500, 200, 100, 50, 20, 10 and 5 euros. The notes are uniform throughout the euro
area; unlike coins, they have no national side. The designs are symbolic for
Europe's architectural heritage. They do not represent any existing monuments.
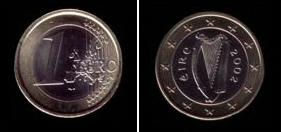
There are 8 euro coins denominated in 2 and 1 euros, then 50, 20, 10, 5, 2
and 1 cents. Every euro coin carries a common European face. On the reverse,
each Member State has their own motif. In the case of Irish coins they have a
harp, the date and the word "Éire".
 vocabulary:
|
expatriate |
emigrációban élő |
sources:
Wikipedia,
Republic of Ireland
CIA - The World Factbook
www.eu2004.ie
Sean's Site
Census 2002 - Principal
Socio-Economic Results
Finfacts Ireland