Social Trends in the United Kingdom
![]()
The population of the UK is growing, as is the number of homes that people live in. Families and households are changing as more people are living alone, and more young people are living with their parents. Cohabitation and births outside marriage are continuing to rise. People are travelling more, but there is also increasing pressure on our environment and natural resources, as carbon dioxide emissions from transport and our use of natural gas for energy continue to rise.
3. Expenditure
5. Housing
6. Transport
7. Population
10. Health
11. Environment
12. Lifestyles
§
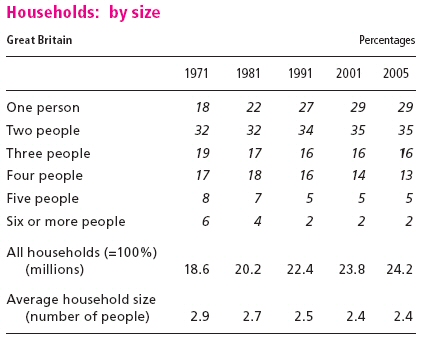
The proportion of one-person households in Great Britain increased by 9 percentage points between 1971 and 1991, and a further 2 percentage points to 29 per cent in 2001 and then remained at this level to 2005.
§
The number of households in Great Britain increased by 30 per cent between 1971
and 2005 from 18.6 million to 24.2 million.
![]()
§
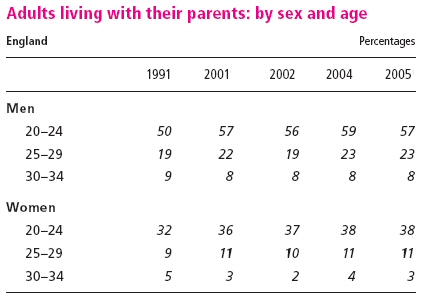
In England, young men were more likely than young women to live with their
parents. In 2005, 57 per cent of men aged 20 to 24 did so compared with 38 per
cent of women of the same age.
![]()
§ In spring 2005 nearly one in four dependent children lived in a lone-parent family in Great Britain.
§
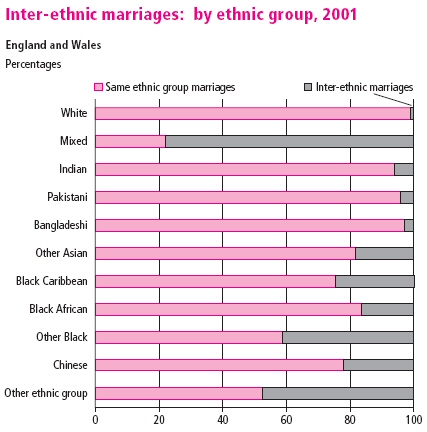
In 2001 people from the Mixed ethnic group were the most likely to be married to
someone outside their ethnic group in England and Wales.
Inter-ethnic marriage defined
as a marriage between people from different aggregate ethnic groups. For
example, a White person married to someone from a non-White ethnic group or a
Pakistani person married to someone from a non-Asian ethnic group.
![]()
ú
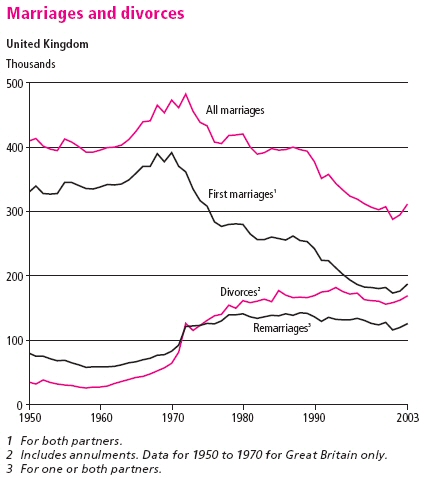
Marriages increased for the third successive year in England and Wales, Scotland
and Northern Ireland in 2004. The lowest annual number of marriages since 1897
was seen in 2001.
![]()
ú The number of marriages in England and Wales that were the first for both partners peaked in 1970 at almost 340,000. It has since fallen to less than half this number in 2004.
ú Over the past few decades people have tended to marry later in life. The average age for first marriages in England and Wales in 2004 was 31 for men and 29 for women. This compares with 25 and 23 for men and women respectively 40 years earlier.
ú The trend towards marriage at older ages is partly down to more people living together prior to, or instead of, marriage. But it is also consistent with other trends, such as increased and longer participation in further and higher education, later leaving of the parental home and later childbearing.
ú Remarriages rose by about a third between 1971 and 1972 following the introduction in England and Wales of the Divorce Reform Act 1969 (made divorce too ‘easy’) and then levelled off. In 2004, 49,540 marriages were remarriages for both parties, accounting for 18 per cent of all marriages.
ú
Since 1992, there have been more civil marriage ceremonies in England and Wales
than religious ceremonies. In 2004, 68 per cent of marriages were solemnised by
civil ceremonies. The Marriage Act 1994 provided for civil marriages to take
place in approved premises from 1 April 1995. In 2004, 31 per cent of all
marriages in England and Wales took place in approved premises, compared with 5
per cent in 1996.
§
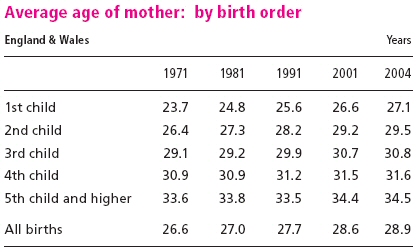
In England and Wales the average age of mothers at childbirth increased by over
two years from 26.6 in 1971 to 28.9 in 2004.
![]()
§
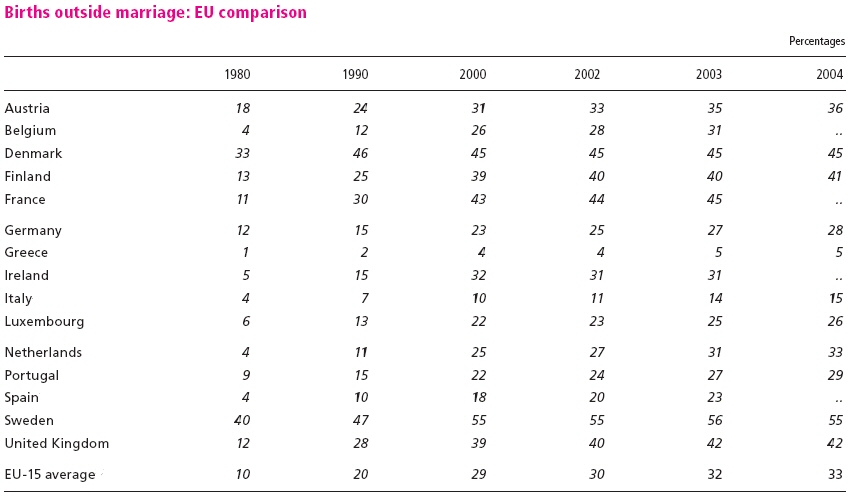
There has been a rise in the proportion of
births occurring outside marriage. In 1980, 12 per cent of all births in the
United Kingdom were outside marriage; by 2004 this had increased to 42 per cent.
![]()
§
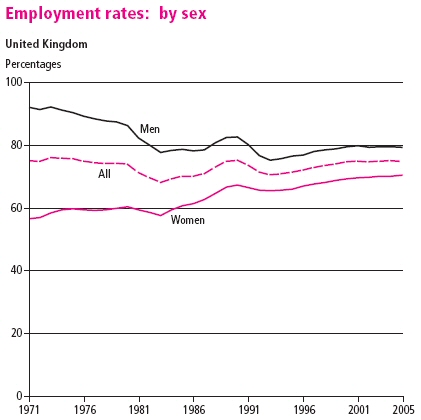
The UK employment rate of working-age men fell from 92 per cent in 1971, to 79
per cent in spring 2005, having reached a low of 75 per cent in 1993, while the
rate for working-age women rose from 56 per cent to 70 per cent.
![]()
§
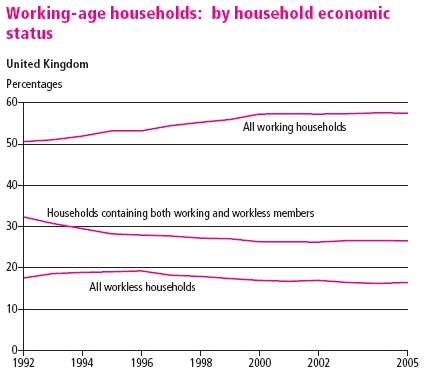
In spring 2005, around 16 per cent of working-age households in the United
Kingdom were workless – where no one of working age is in employment.
![]()
§
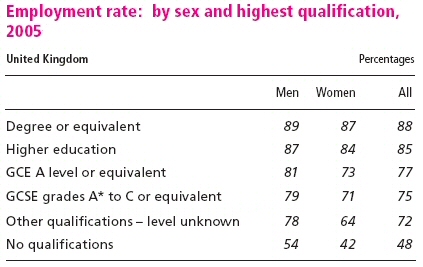
In spring 2005, 88 per cent (![]() 92.5%) of working-age people with a degree or equivalent in
the United Kingdom were in employment compared with only 48 per cent
(
92.5%) of working-age people with a degree or equivalent in
the United Kingdom were in employment compared with only 48 per cent
(![]() 2.4%) of those
with no qualification.
2.4%) of those
with no qualification.
![]()
§
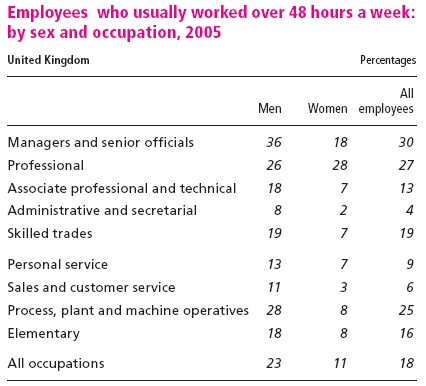
In spring 2005, nearly one in five full-time employees in the United Kingdom
usually worked over 48 hours a week, with a higher proportion of male employees
(23 per cent) than female (11 per cent) usually working these longer hours.
![]()
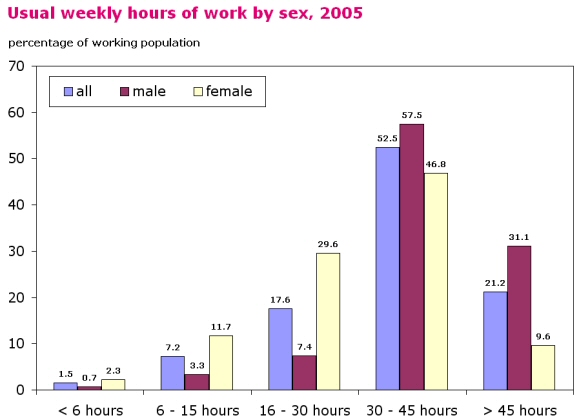
§
The majority of the working population works more
than 30 hours a week and almost the third of the male working population works
more than 45 hours a week.
![]()
§
In 2004 the number of debit card transactions in the United Kingdom was ten
times higher than it had been in 1991. Over the same period credit card usage
increased by a factor of almost three.
![]()
§
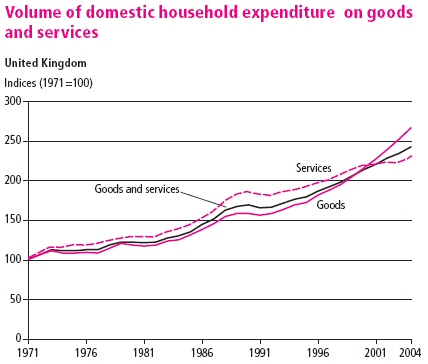
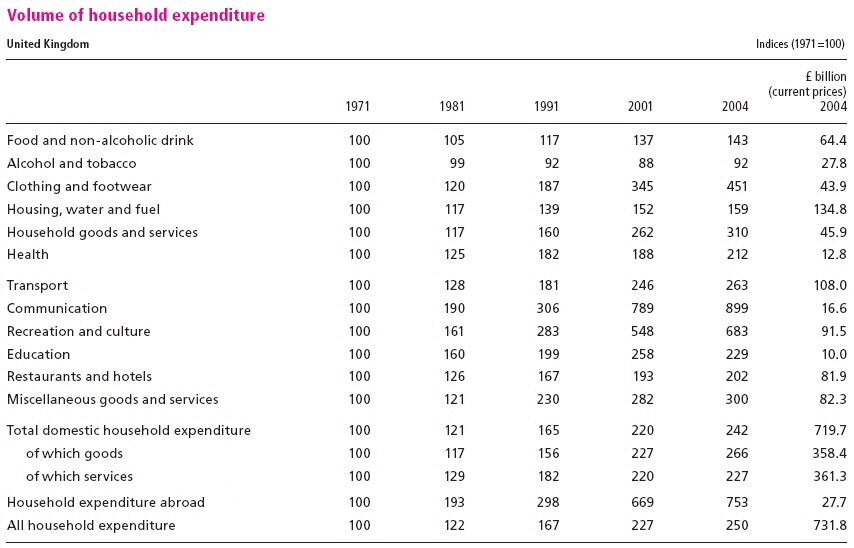
Between 1996 and 2004 the volume of expenditure by UK households on goods grew
at an average rate of 5.0 per cent per year. This was nearly three times the
rate for expenditure on services, which grew at 1.8 per cent per year.
![]()
§
The greatest increase in the volume of spending between 1971 and 2004 has been
on communications, with a ninefold rise.
![]()
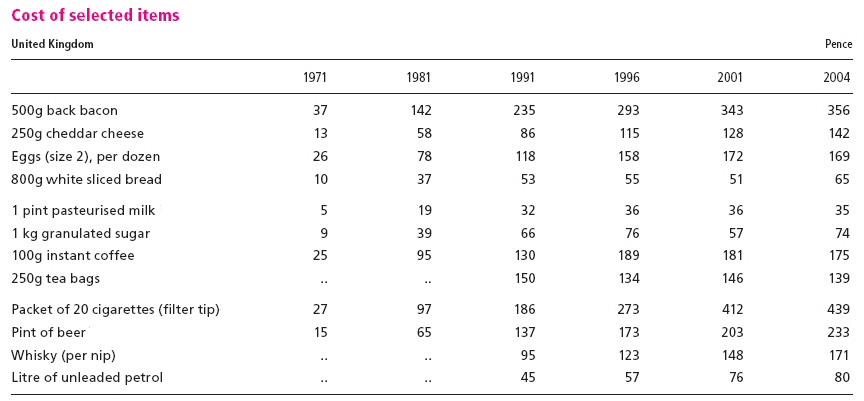
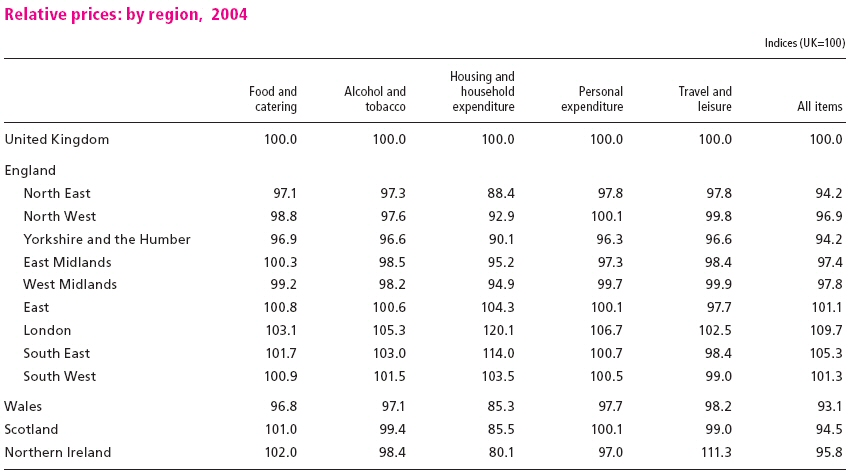
§
See the cost of selected items and their relative prices throughout the UK:
![]()
§ In 2004/05 the average number of visits per month to the NHS Direct Online website was 774,000, compared with 169,000 visits in 2001/02. (The NHS Direct Online website provides a wealth of quality assured, evidence based health information.)
§ In 2003 the majority of families where the mother was working were using some form of childcare. Around two thirds of children up to the age of ten received informal childcare in Great Britain.
§
Between 1971 and 2004 the number of dwellings in Great Britain increased by 35
per cent, to 25.3 million.
§
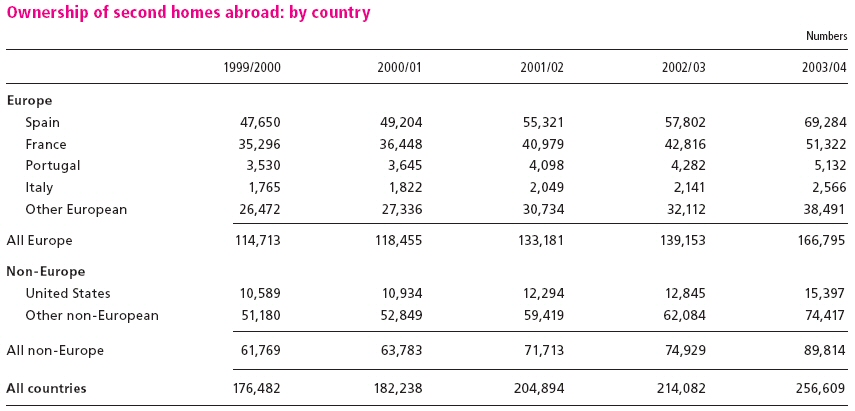
Between 1999/2000 and 2003/04 the number of UK households that owned second
homes abroad increased by 45 per cent to reach almost 257,000. Almost half of
these homes were located in Spain and France.
![]()
§
Between March 2003 and March 2005 the total number of homeless households in
England living in B&B hotels (Bed and Brekfast) fell by 45 per cent to
6,800.
§
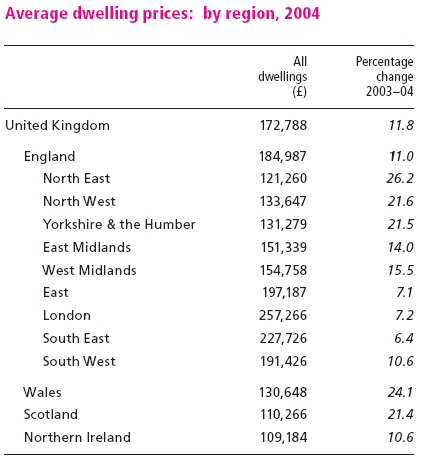
In 2004 annual house price inflation was highest in the North East at 26 per
cent, although average property prices here were still lower than in any other
region of England.
![]()
§
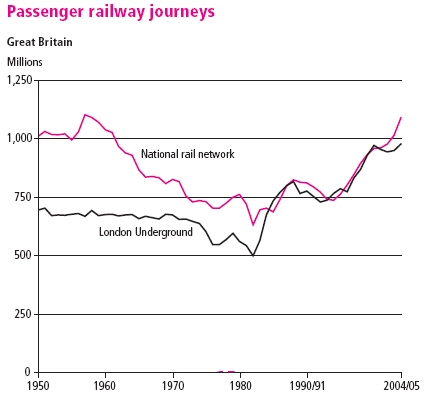
In 2004/05 more than 1 billion passenger journeys were made on the national rail
network for the second year running, the highest it has been since 1961.
![]()
§
Travel in London accounts for over one third of all passenger journeys in Great
Britain on local buses.
§ Over 4.6 billion journeys in Great Britain were made by local bus in 2004/05, more than twice the number made by rail.
§
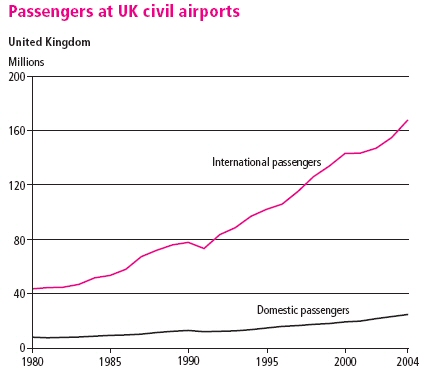
Between 1980 and 2004, the number of air passengers travelling to or from
overseas countries through UK airports (excluding those in transit) almost
quadrupled from 43 million to 167 million.
![]()
§
Between 1991 and 2004/05, UK household expenditure on motoring increased by 30
per cent in real terms, while spending on fares and other travel costs rose by
20 per cent. (Table 12.19)
§
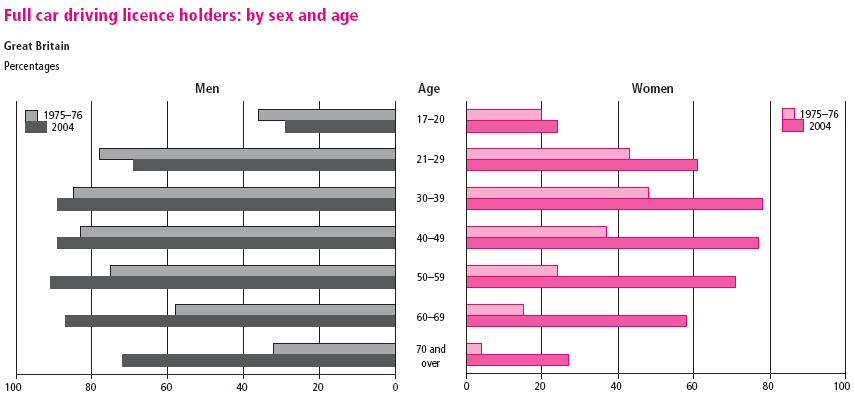
Historically men have been much more likely
than women to hold full car driving licences. However this gap between men
and women is getting smaller. The gap between the sexes is smallest in the
youngest age groups and largest in the oldest.
![]()
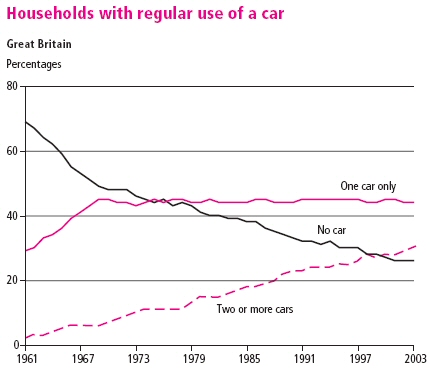
§
There has been significant growth in the
proportion of households with two or more cars – from 7 per cent in 1970 .to 30
per cent in 2003.
![]()
§
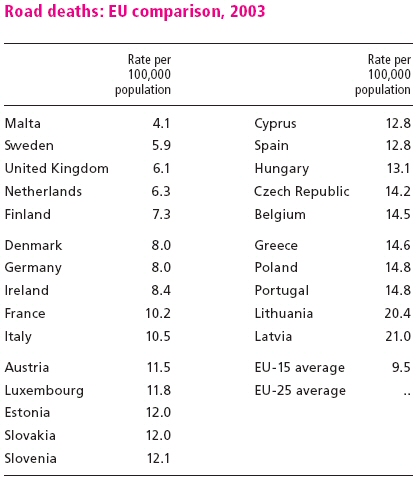
According to the Organisation for Economic Co-operation and Development, the
United Kingdom had one of the lowest road death rates in the EU-25, at 6.1 per
100,000 population in 2003.
![]()
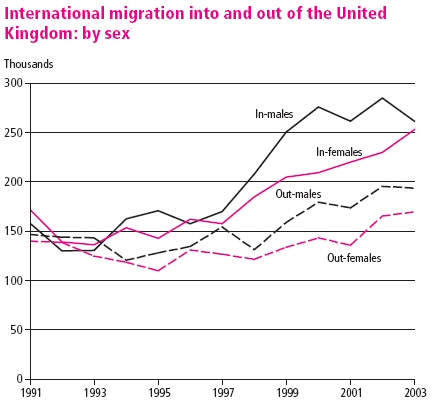
§
In 2004 nearly 222,600 more people migrated to the United Kingdom than left it.
This was 71,600 greater than in 2003 and the highest net inflow since the
present method of estimation began in 1991.
![]()
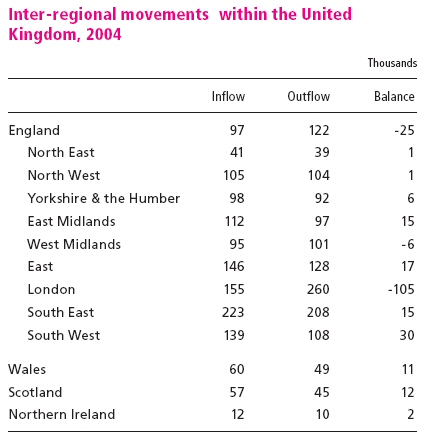
§
In 2004 England recorded a net loss of 25,000 people to other parts of the
United Kingdom while other countries experienced a net inflow. Within England,
London experienced the largest net loss of 105,100 people moving to elsewhere in
the United Kingdom.
![]()
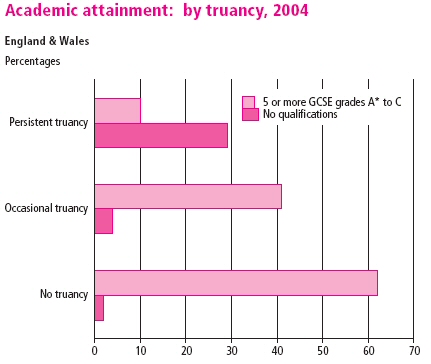
§
In 2004 persistent
truants in year 11 (15-16 year old)
in England and Wales were around six times less likely than those who did not
truant to gain five or more GCSEs grades A* to C (or the equivalent).
![]()
§
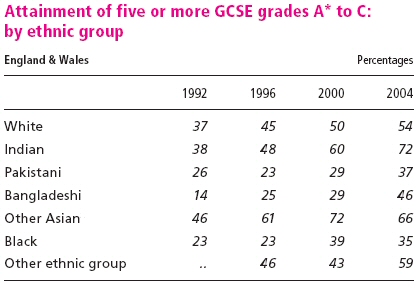
Indian pupils, as well as being the most likely to achieve five or more GCSE
grades A* to C (or equivalent) in 2004, also showed the largest improvements
over the last 12 years
![]()
§ In 2004/05, 81 per cent of eligible students in the United Kingdom took out a loan to support them through higher education, the average amount being £3,390.
§
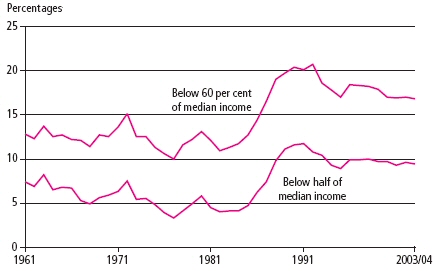
The proportion of people living in households below 60 per cent of median*
disposable income in the Great Britain has been stable between 2000/01 and
2003/04, at 17 per cent.
![]()
*The median income is the amount of money the
most people earn.
§
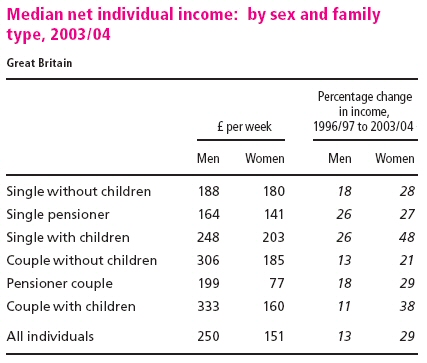
Although the gap between men’s and women’s incomes is still substantial in Great
Britain, it narrowed between 1996/97 and 2003/04. Median net income of women
increased by 29 per cent in real terms compared with an increase of 13 per cent
for men.
![]()
§
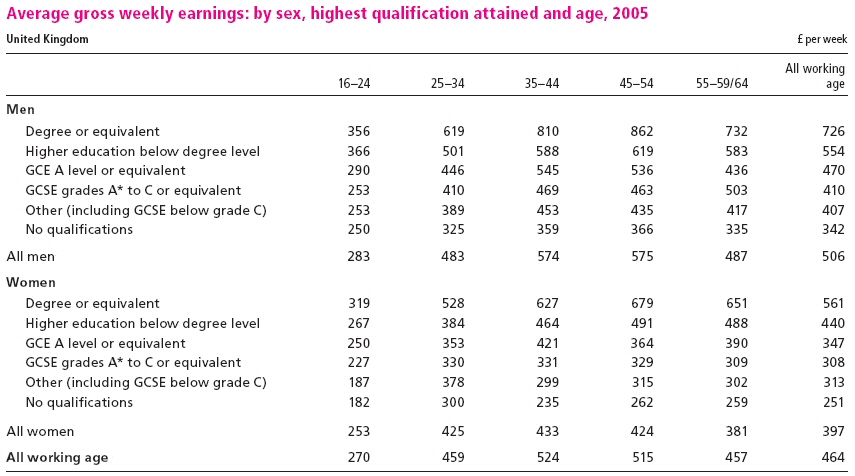
In spring 2005, average gross weekly earnings in the United Kingdom for both men
and women with a degree or equivalent were double those of men and women with no
qualifications.
![]()
§
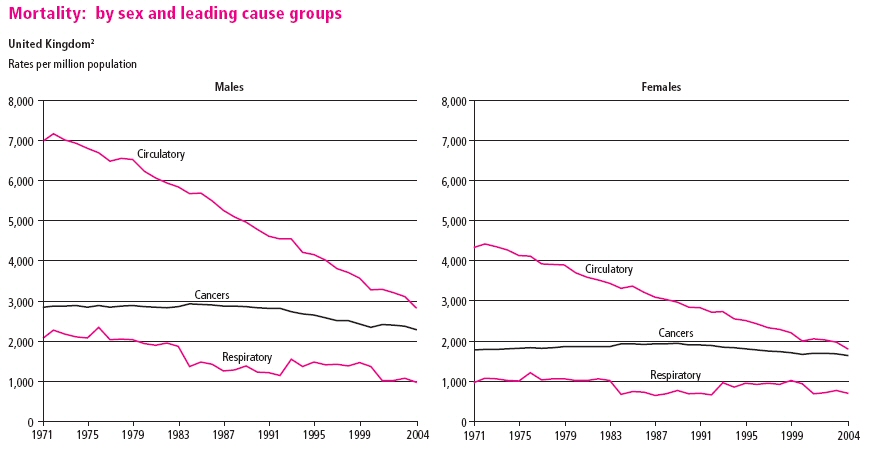
While circulatory diseases (which include CVD - cardiovascular diseases) have remained the most
common cause of death in the United Kingdom over the past 30 years, they have
also shown by far the greatest decline, particularly among males.
![]()
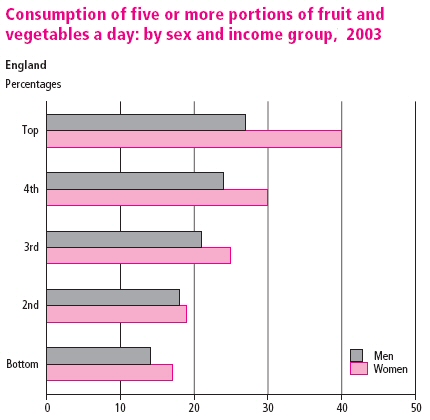
§ In 2003, 40 per cent of women and 27 per cent of men in the highest fifth of the income distribution in England ate five or more portions of fruit and vegetables a day compared with 17 per cent of women and 14 per cent of men in the lowest fifth.
§
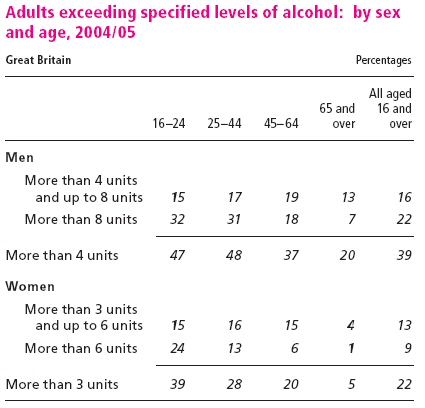
In 1995 the government changed its guidelines on sensible
drinking from weekly to daily
benchmarks. Its advice is based on daily benchmarks of between three
and four units per day for men and two to three units per day for women.
![]()
ú
In 2004/05 men were more likely than women to exceed these
benchmarks on at least one day during the previous week - 39 per cent of men
compared with 22 per cent of women. Between 1998 and 2004/05 there was little
change in the proportions of men and women exceeding the daily benchmarks.
ú
Younger people were more likely than older people to exceed the daily
benchmarks. Just under half (47 per cent) of men aged 16 to 24 had drunk more
than four units on at least one day during the previous week compared with 20
per cent of men aged 65 and over. Among women, 39 per cent of those aged 16 to
24 had exceeded three units on at least one day compared with only 5 per cent of
those aged 65 and over.
ú
Heavy drinking - defined as over eight units a day for men and six units a day
for women on at least one day during the previous week - was more common among
men than women. In 2004/05, 22 per cent of men compared with 9 per cent of women
had exceeded these amounts. Heavy drinking among both men and women has shown
little change between 1998 and 2004/05.
ú Heavy drinking was also more common among young people: 32 per cent of men and 24 per cent of women aged 16 to 24 had drunk heavily on at least one day during the previous week. Among those aged 65 and over, these proportions were just 7 per cent and 1 per cent respectively.
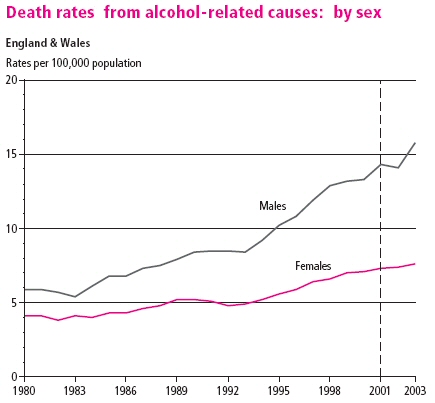
ú
Between 1980 and 2003 the
alcohol-related death rate among males rose by over two and a half times to
reach 15.8 per 100,000
![]()
§
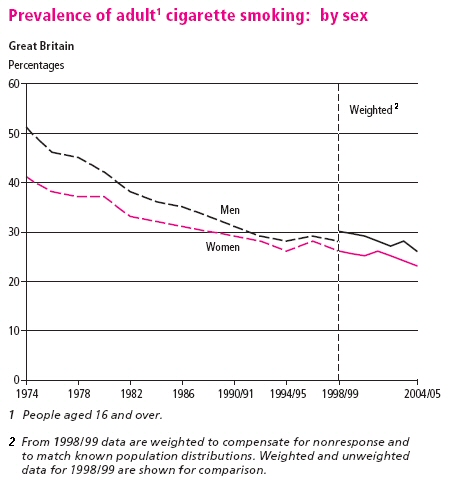
While men are still more likely than women to smoke cigarettes, the gap has
narrowed. In 1974, 51 per cent of men and 41 per cent of women in Great Britain
smoked. In 2004/05, 26 per cent of men and 23 per cent of women were cigarette
smokers. In 2004/05, 25 per cent of adults aged 16 or over in Great Britain
smoked cigarettes, indicating a slight fall in the prevalence of smoking among
both men and women since the late 1990s.
The proportion of adults who smoked cigarettes fell substantially in the 1970s
and the early 1980s – from 45 per cent in 1974 to 35 per cent in 1982. After
1982 it declined gradually until the early 1990s, levelling out during the
1990s. It then fell smoothly from 28 per cent in 1998/99 to 25 per cent in
2004/05.
![]()
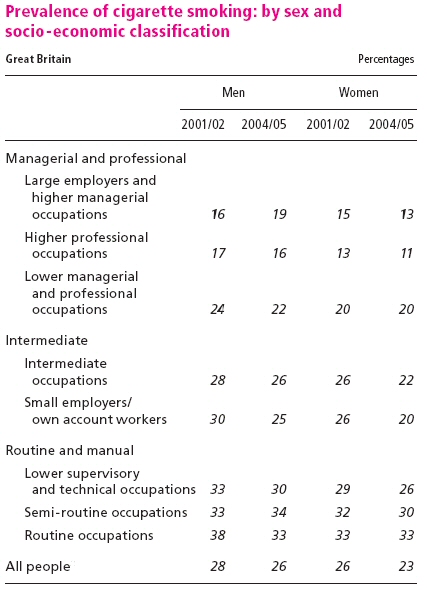
ú
Smoking is strongly
associated with socio-economic classification, being
far more common among those in routine and manual occupational
groups than those in managerial and professional groups.
![]()
ú
Cigarette smoking continues to be more common among adults aged 20 to 34 than
among other age groups. In 2004/5, 32 per cent of adults aged 20 to 24 and 31
per cent of adults aged 25 to 34 were smokers compared with 14 per cent of those
aged 60 and over.
ú
As well as being slightly more likely than women to be cigarette smokers, men
are also heavier smokers, on average. In 2004/05, men smokers smoked an average
of 15 cigarettes a day, compared with 13 a day among women smokers.
ú
The proportion of men who were heavy smokers (on average 20 or more cigarettes a
day) fell from 14 per cent in 1990 to 10 per cent in 1998. Among women, the
proportion fell from 9 per cent to 7 per cent over the same period. Since then
the proportions have remained virtually unchanged.
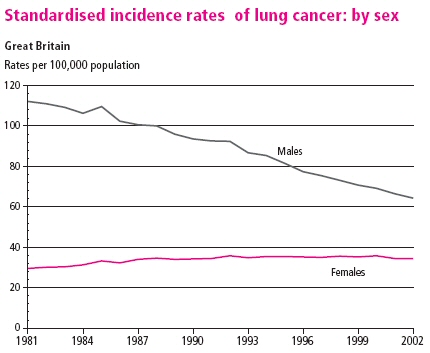
ú
See the positive correlation between the decrising smoking
population and the falling incidence rates of lung cancer.
![]()
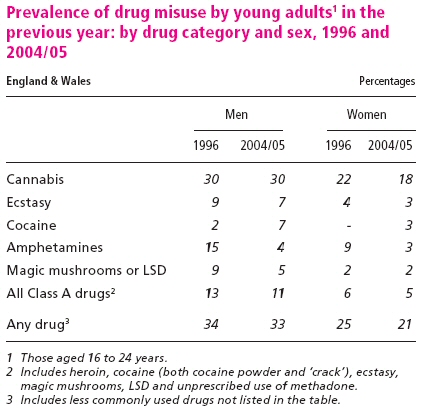
§
The
misuse of drugs is both a serious social and health problem.
Results from the 2004/05 British Crime Survey indicate that 16
per cent of men and 9 per cent of women aged 16 to 59 in
England and Wales had taken an illicit drug in the previous year. Young
people were more likely than older people to misuse
drugs; 33 per cent of men and 21 per cent of women aged 16 to 24
had done so in the previous year.
Cannabis
remained the most commonly used drug among young people, used
by 30 per cent of men and 18 per cent of women in the
previous year.
![]()
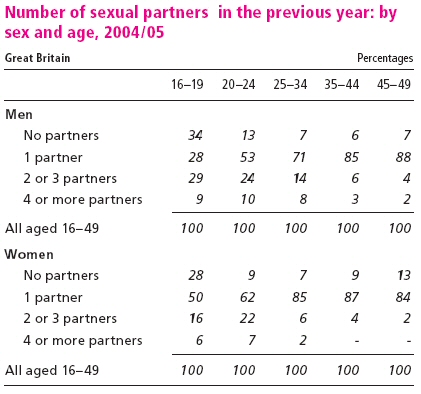
§ Since the late 1990s the increase in the prevalence of sexually transmitted diseases, especially among young people, has become a major public health concern across the United Kingdom. Those who have unprotected sex and multiple sexual partners are at the greatest risk of contracting a sexually transmitted infection. During 2004/05 men were more likely than women in Great Britain to have had more than one sexual partner in the previous year for all age groups aged under 50. For both sexes, multiple sexual partnerships were most common among those below the age of 25.
In 2004/05 more than a third of men aged under 25 in Great Britain reported having more than one sexual partner in the previous year compared with a fifth of women aged 16 to 19 and a quarter aged 20 to 24.
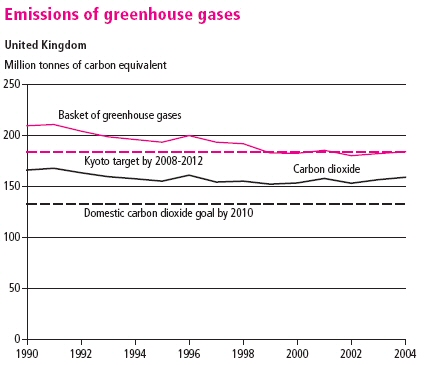
§
Emissions of greenhouse gases (they are
considered to be responsible for global warming and climate change)
in the United Kingdom fell by 12.5 per cent between 1990 and 2004, although they
rose between 2002 and 2004. Germany
was generating almost a quarter, and the United Kingdom a sixth, of the EU-15
total greenhouse gas emission.
![]()
§
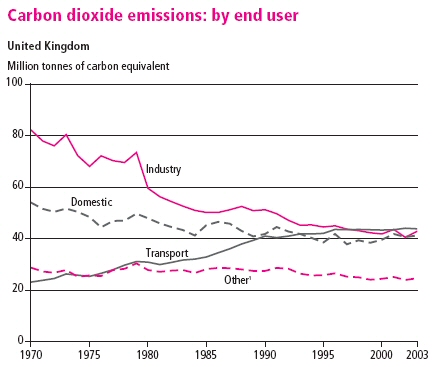
Emissions from both domestic
and industry end users have fallen since 1970, by 24 and 48 per cent
respectively between 1970 and 2003. Conversely, emissions from transport have
nearly doubled over the same period.
![]()
§
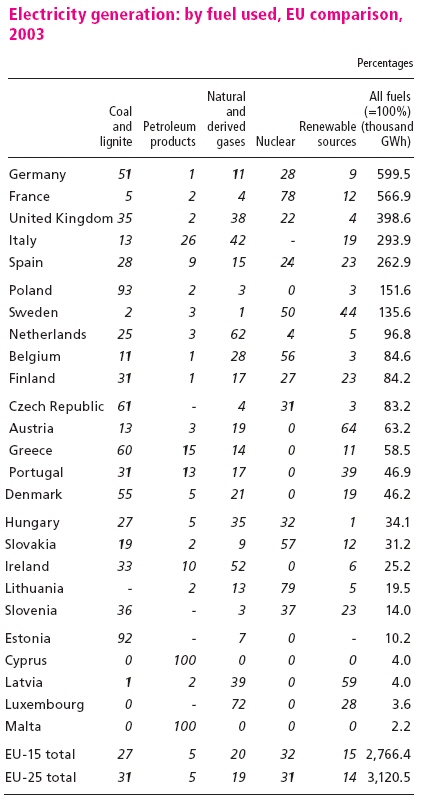
Around 4 per cent of electricity produced in the United
Kingdom in 2003 came from renewable sources, compared with an EU-15 average of
15 per cent.
![]()
§
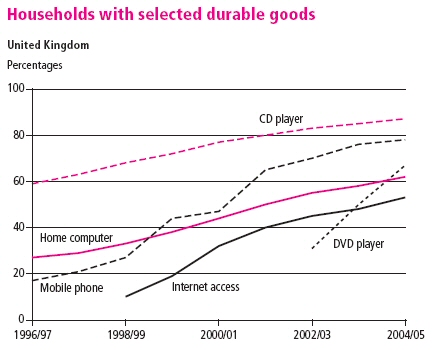
A period of
technological change has brought about the widening application of
information and communication technology (ICT). Home
ownership of CD players, DVD players, computers, Internet
access, and mobile phones has risen substantially over the last five or six
years.
![]()
§
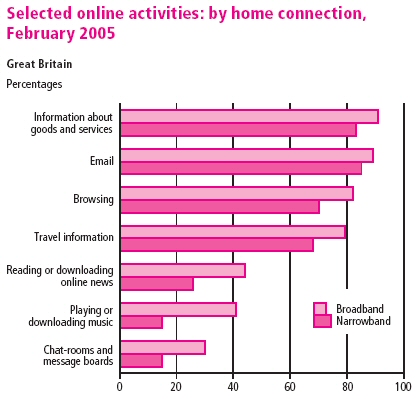
When people go online,
there are many activities they can engage in, of which the
most popular in February 2005 were email and looking
for information about goods and services (both 85 per cent) and general browsing
(72 per cent).
![]()
§
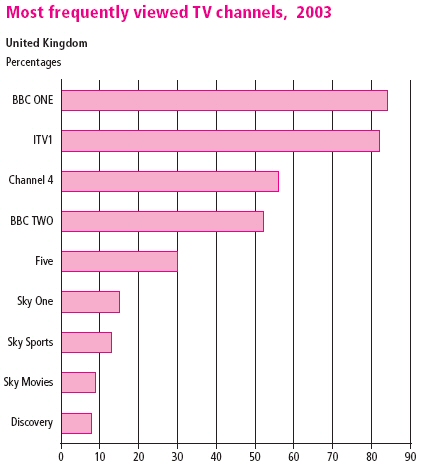
Nearly nine in ten adult viewers in the United Kingdom
watched television every day of the week in 2003, with nearly a quarter of
viewers watching it for two to three hours a day and
one in ten viewing for over seven hours.
The top five channels watched most often by adults in 2003 in
the United Kingdom were the major terrestrial channels, BBC
ONE, ITV1, Channel 4, BBC TWO and Five.
![]()
§
Nearly three
quarters of adults in the United Kingdom in 2003 stated that
television was their main source of national news. This was
followed by 13 per cent stating that newspapers were their
main source of national news and 10 per cent the radio. Nearly
four out of five people (78 per cent) stated that television was
their main source of world news followed by newspapers
(10 per cent) and radio (7 per cent).
Radio is a secondary medium; it is listened to while people do other things such
as commuting or working. In
2004, nearly six in ten people in the United Kingdom listened to
the radio while getting up or having breakfast on weekdays.
Other most popular times for listening to the radio on
weekdays were travelling in the car (56 per cent) and travelling to
and from work (46 per cent and 43 per cent respectively).
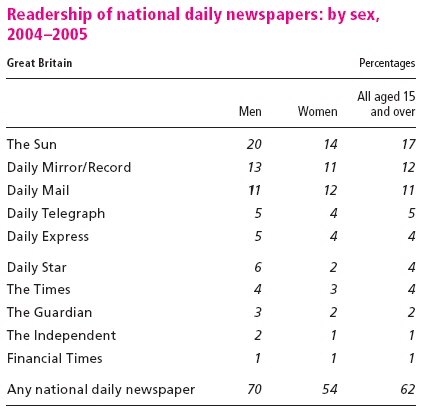
Almost two thirds of all people aged 15 and over in Great
Britain read a national daily newspaper in the year to June
2005.
The Sun was the most read paper with
nearly one in five people reading it, followed by the Daily Mail. Men
tended to read newspapers more than women.
![]()
§
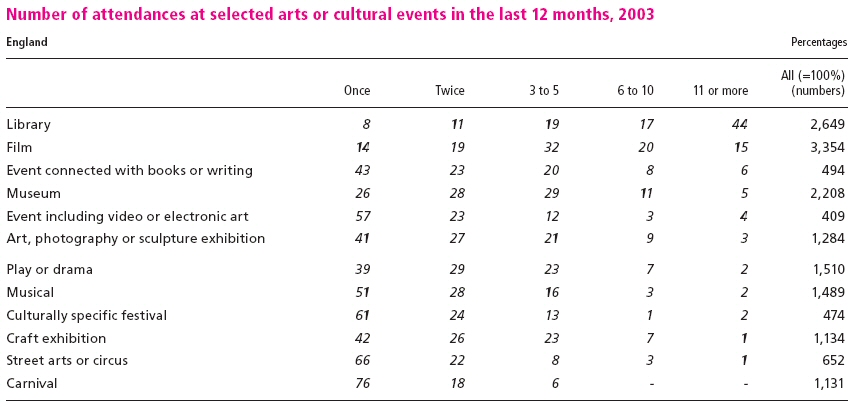
The main reasons given for
attending at least one of the selected events were that people
liked going to the specific event (36 per cent), they went
to see a specific performer or event (19 per cent) or they
went as a social event (18 per cent). The main reasons for not
attending events were the difficulty of finding time (48 per cent) and cost (34
per cent).
![]()
§
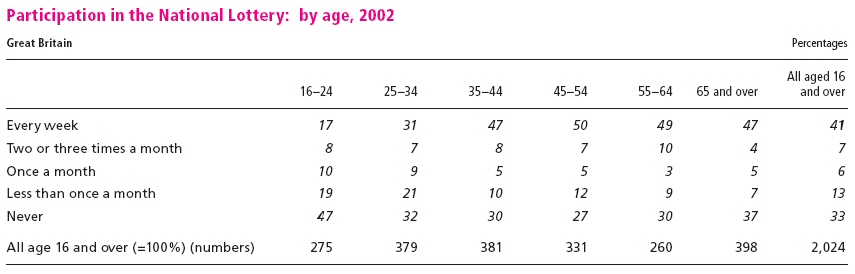
The National Lottery
which started in 1994 has funded around 185,000 social or
cultural projects. Just over four in ten adults aged 16 and over in
Great Britain participated in any of the National Lottery games every week in
2002.
![]()
§ The United Kingdom has almost 6,500 visitor attractions, including country parks and farms, historic properties, theme parks, zoos, gardens, museums and galleries, and places of worship. The top two visitor attractions that charged admission in England in 2004 were the British Airways London Eye, which had 3.7 million visitors, and the Tower of London, with 2.1 million visitors. The top visitor attractions that charged admission in Scotland in 2004 were Edinburgh Castle (1.2 million visitors) and Edinburgh Zoo (600,000 visitors), while in Wales it was Portmeirion (254,000 visitors) and Caernarfon Castle (202,000 visitors). The top attractions in Northern Ireland excluding country parks or gardens that charged admission were the Giants Causeway Visitor Centre (445,000 visitors) and the W5 interactive discovery centre (246,000 visitors).
|
|
With 140 amazing interactive exhibits in five incredible exhibition areas, W5 provides a unique experience as well as fantastic fun for visitors of all ages. In addition to permanent exhibits, W5 also presents a changing programme of large and small scale temporary exhibitions and events. They also have a daily programme of live science demonstrations and shows throughout the day. |
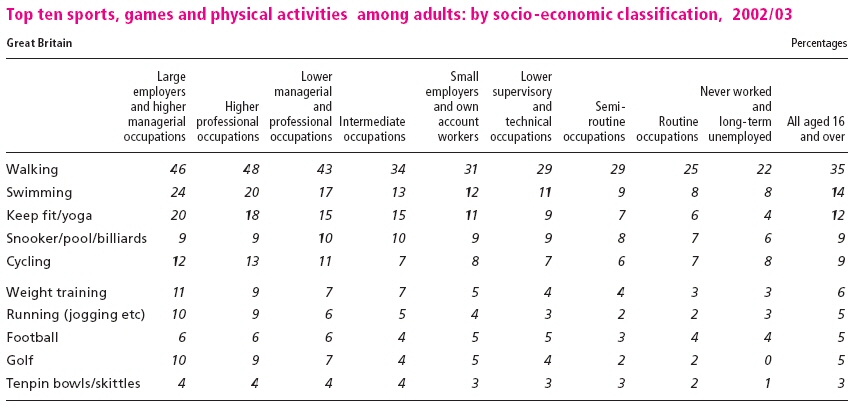
§
In 2002 three quarters
of adults in Great Britain had taken part in a sport, game or
physical activity in the 12 months before interview and three
fifths had done so in the previous four weeks. When walking is
excluded these proportions fall to two thirds and two
fifths respectively. Over the 12 month period before interview
walking (46 per cent) was the most popular sports activity
followed by swimming (35 per cent), keep fit/yoga including
aerobics and dance exercise (22 per cent), cycling (19 per
cent) and cue sports (17 per cent). Men were more likely
than women to have participated in at least one sport, game or
physical activity, in either the 4 weeks or 12 months before
interview. Four in ten men participated in an organised
competition in the 12 months before interview, compared with one in
seven women. There was a clear relationship between socio-economic status and participation rates in sports, games and physical activities
in the four weeks before interview.
![]()
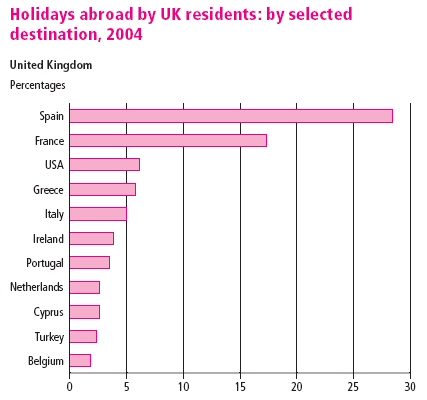
§
UK residents made a record 42.9 million holiday trips
abroad in 2004, an increase from 6.7 million in 1971; Spain was the most popular
destination, followed by France.
![]()
§ The official turnout in the May 2005 General Election was 61 per cent, a small increase on the 59 per cent turnout recorded in 2001. The Labour Party retained control of Parliament after gaining 355 seats; they received 35 per cent of the vote, lower than any previously recorded share for a winning party.
§ Nearly 90 per cent of the money is raised by just over 7 per cent of the charities.
Just under two thirds of adults in the UK gave money to charity in 2003. The average monthly donation was £12.32.
§ There are a variety of different ways to give to charity. The most popular was through street or door-to-door collections, while the most income was obtained from voluntary donations and grants.
§ Volunteering is one of the ways in which individuals help their community, from formal volunteering activities such as organising an event to informal activities such as looking after a pet for someone. According to the 2003 HOCS, 62 per cent of people had taken part in at least one form of volunteering in the previous 12 months while 37 per cent had volunteered at least once a month. The most common types of informal volunteering were giving advice (44 per cent) and looking after a property or pet while someone was away (38 per cent). The most frequently reported types of formal volunteering were raising or handling money/taking part in sponsored events (53 per cent) and organising or helping to run an activity or event (49 per cent). people with higher educational qualifications were more likely to volunteer than those with no qualifications.
|
truant |
iskolakerülő |
|
benchmark |
határérték |
sources:
extracted from Social Trends No36 - 2006 edition © Crown Copyright 2006, under PSI licence
![]()