Index of /adatok/Anglisztika/49Pintťr/LRSetup/USA/SOCIETY/images
Name
Last modified
Size
Description
Parent Directory
-
Total population by state_2.jpg
2006-05-29 20:58
44K
Total population by state FELIRAT.jpg
2006-05-29 20:57
276K
Total population by state.jpg
2006-05-08 19:50
219K
Total population by region 1900 - 2000.jpg
2006-05-08 19:50
64K
Total population 1900 - 2000.jpg
2006-05-08 19:50
48K
Thumbs.db
2006-05-28 09:24
7.5K
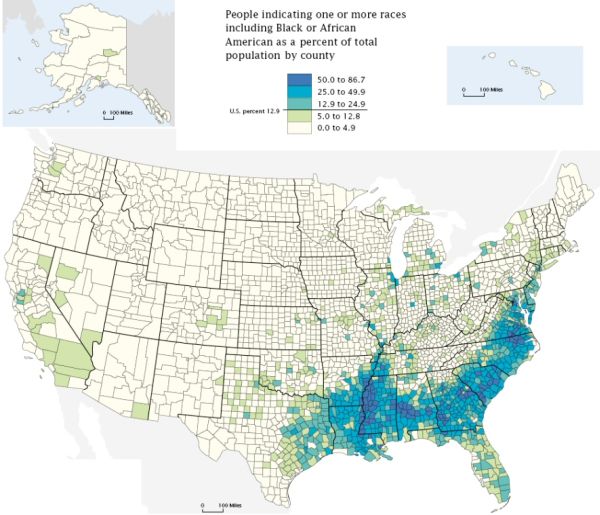
Ten places with the highest percentage of blacks.jpg
2006-05-08 19:50
80K
Population density by region .jpg
2006-05-08 19:50
64K
Population density 1900 - 2000.jpg
2006-05-08 19:50
67K
PopDensCounties_2004.jpg
2006-05-08 21:25
176K
Percent of race other than white.jpg
2006-05-08 19:50
233K
Percent of population living in metropolitan areas.jpg
2006-05-08 19:50
218K
Percent minority by region 1980 - 2000.jpg
2006-05-08 19:50
50K
Percent living in metropolitan areas by region 1910 - 2000.jpg
2006-05-08 19:50
76K
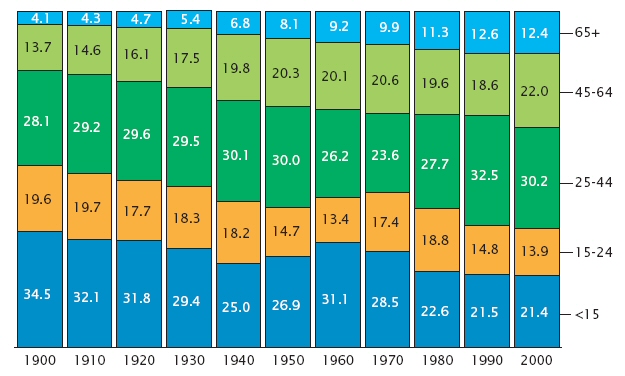
Percent distribution of total population by age 1900 - 2000.jpg
2006-05-08 19:50
113K
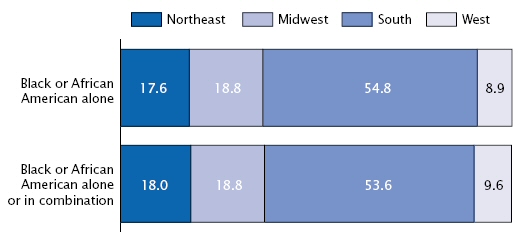
Percent distribution of blacks by region.jpg
2006-05-08 19:50
35K
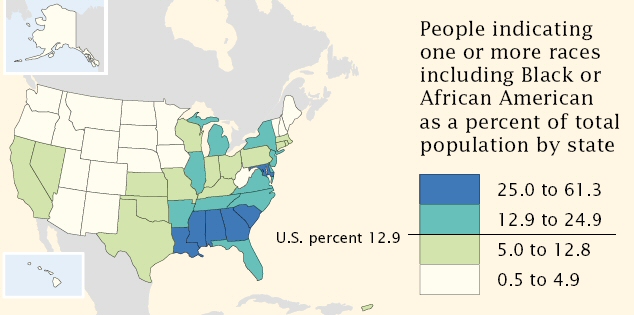
Percent black 2000 by state small.jpg
2006-05-08 19:50
101K
Percentage Distribution of Population 2000_2.jpg
2006-05-29 20:34
25K
Percentage Distribution of Population 2000.jpg
2006-05-08 19:50
163K
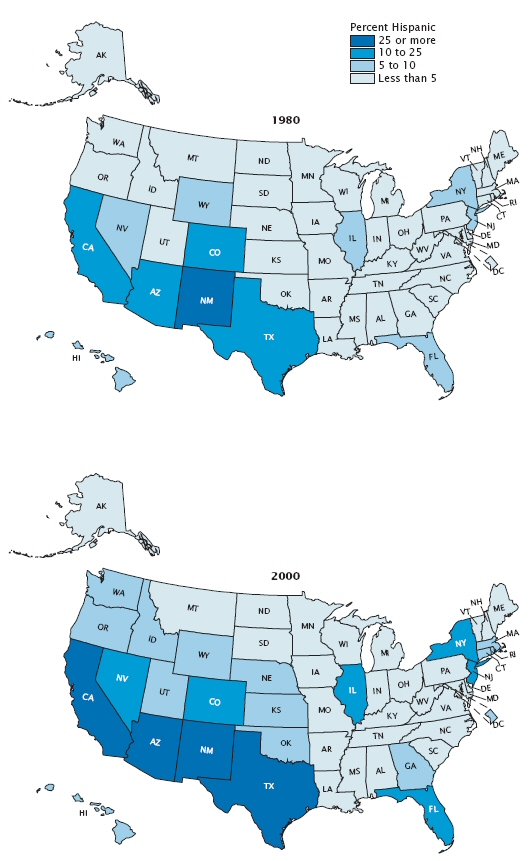
Percent Hispanic by state 1980 - 2000.jpg
2006-05-08 19:50
193K
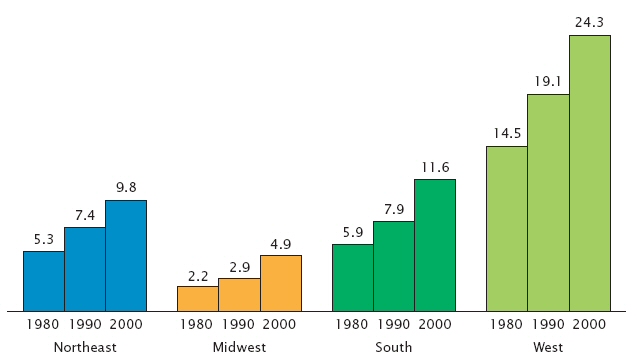
Percent Hispanic by region 1980 - 2000.jpg
2006-05-08 19:50
43K
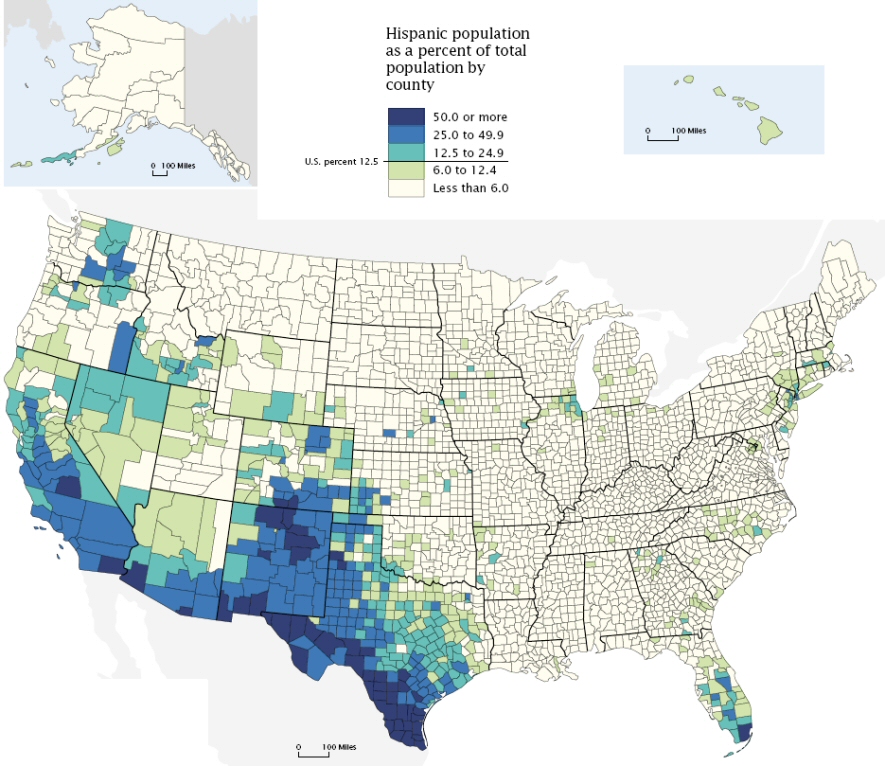
Percent Hispanic 2000.jpg
2006-05-08 19:50
373K
Percent Black 2000_2.jpg
2006-05-29 21:12
61K
Percent Black 2000.jpg
2006-05-08 19:50
381K
Largest ancestry groups_2.jpg
2006-05-29 21:09
19K
Largest ancestry groups.jpg
2006-05-27 08:34
70K
Hispanic population 1980 - 2000.jpg
2006-05-08 19:50
35K
Distribution of total population by race 1900 - 2000_3.jpg
2006-05-29 21:28
23K
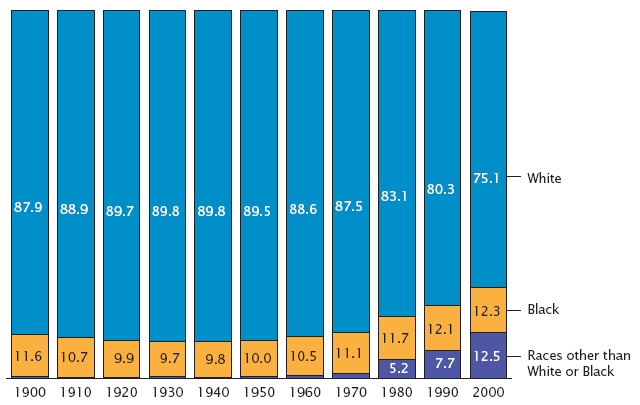
Distribution of total population by race 1900 - 2000.jpg
2006-05-08 19:50
90K
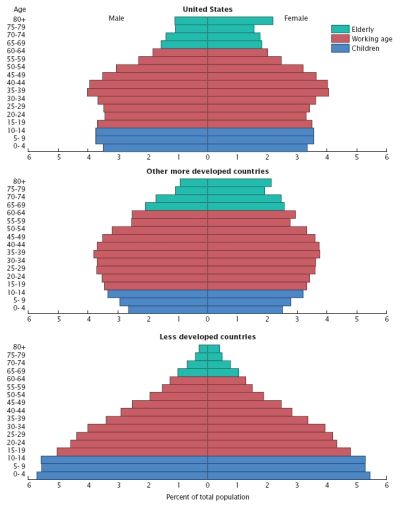
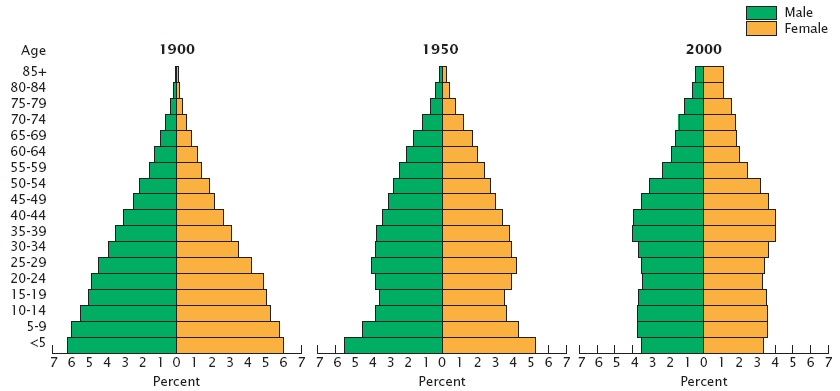
Age and sex distribution 1900-1950-2000.jpg
2006-05-08 19:50
96K
Apache/2.4.68 (Debian) Server at gepeskonyv.btk.elte.hu Port 443