Society of the United States of America
The Population of the US - Census Data
The Population
of the US – Census Data
The Constitution of the
The most recent census
in the
Despite the continuing population growth, the average population
density of the ![]()
![]() ).
).
 Percentage distribution of population 2000 |
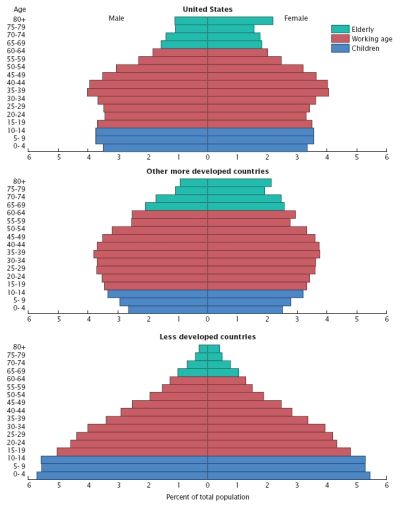
The vital statistics of American population reveal trends that are generally characteristic of “more developed
countries” (this is the collective term of demographers for Europe, North
America, Australia, New Zealand, and Japan) as opposed to “less developed
countries” (the rest of the world, used to be called “third world”). The
If one examines the distribution of age groups within the ![]()
The distribution of
Population figures of US cities can be misleading because the number of
people living within the administrative boundaries of the city itself might be
relatively small; however, millions more live in the surrounding
suburbs or commute from nearby cities and suburbs. Therefore, statisticians
prefer to use the term ‘metropolitan area,’ which includes both central cities
and the
 surrounding enormous suburban areas. The most densely populated region
of the country is the so-called “Megalopolis”,
the string of big cities and urban areas stretching from Boston in southern
New
England along the coastal areas of New York,
New
Jersey,
Pennsylvania and
Maryland to
Washington D.C. (it may be surprising, but
New Jersey is actually the most densely populated state in the US). There are
also a number of large metropolitan areas in the
surrounding enormous suburban areas. The most densely populated region
of the country is the so-called “Megalopolis”,
the string of big cities and urban areas stretching from Boston in southern
New
England along the coastal areas of New York,
New
Jersey,
Pennsylvania and
Maryland to
Washington D.C. (it may be surprising, but
New Jersey is actually the most densely populated state in the US). There are
also a number of large metropolitan areas in the
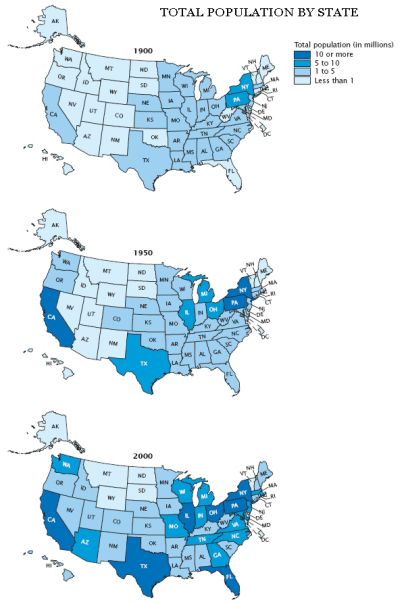
Although all metropolitan areas of the  1900, and Florida may overtake New York to become the third largest state some
time in the near future (see the Sun Belt – Frost Belt distinction in
Climate). The least populated states are – except for Alaska – all located
in the northern
1900, and Florida may overtake New York to become the third largest state some
time in the near future (see the Sun Belt – Frost Belt distinction in
Climate). The least populated states are – except for Alaska – all located
in the northern
Comparing the proportion of metropolitan and rural populations by region, today
the Midwest is relatively the least metropolitan region of the US, since less
than 75% of its population is metropolitan, a little smaller proportion than in
the South. In contrast, in the Northeast almost 90% of the population is
metropolitan (see chart
Percent of population living in metropolitan areas by
region). There are much larger differences between individual states: in 21
states, 75% or more of the population lived in metropolitan areas in 2000,
whereas in 12 states the majority of the population was still rural. The most
metropolitan states were California,
Connecticut,
Florida,
Maryland,
Massachusetts,
New
Jersey, New York, and
Rhode
Island, with over 90% of their population living in metropolitan areas. In
contrast, Idaho,
North Dakota,
South Dakota,
Vermont, and
Wyoming had the highest
proportion of rural people (and, not surprisingly, very small overall
populations) in 2000 (see map
Percent
of Population living in metropolitan areas by state).
The continuous
urbanization
of the
Mostly as a result of the suburban growth, metropolitan areas tend to
increase both in area and in population.
In 2000, 30% of the total
The Ten
Largest Metropolitan Areas in 2000
|
Metropolitan area, state(s) |
Region |
Population in 2000
(rounded) |
|
New York-Northern New Jersey-Long Island,
NY-NJ-CT-PA |
Northeast |
21,200,000 |
|
Los Angeles-Riverside-Orange County, CA
|
West |
16,374,000 |
|
Chicago-Gary-Kenosha, IL-IN-WI |
Midwest |
9,158,000 |
|
Washington-Baltimore, DC-MD-VA-WV |
South |
7,608,000 |
|
San Francisco-Oakland-San Jose, CA |
West |
7,039,000 |
|
Philadelphia-Wilmington-Atlantic City,
PA-NJ-DE-MD |
Northeast |
6,188,000 |
|
Boston-Worcester-Lawrence, MA-NH-ME-CT
|
Northeast |
5,819,000 |
|
Detroit-Ann Arbor-Flint, MI |
Midwest |
5,456,000 |
|
Dallas-Fort Worth, TX |
South |
5,222,000 |
|
Houston-Galveston-Brazoria, TX |
South |
4,670,000 |
Comparative population data of the US,
the UK, and
![]() Hungary
Hungary
|
All data are 2006 estimates! |
United States |
United Kingdom |
Hungary |
|
Population (rounded) |
298,444,000 |
60,609,000 |
9,981,000 |
|
Median Age (years) |
36.5 |
39.3 |
38.7 |
|
Birth rate (annual births per 1000 people) |
14.14 |
10.71 |
9.72 |
|
Death rate (annual deaths per 1000 people) |
8.26 |
10.13 |
13.11 |
|
Population growth rate (annual change, %) |
0.91 |
0.28 |
– 0.25 |
|
Immigration rate (annual immigrants per 1000 people) |
3.18 |
2.18 |
0.86 |
|
Life expectancy (years): total / male / female |
77.9 / 75 / 80.8 |
78.5 /
76.1 / 81.1 |
72.7 / 68.5 / 77.1 |
|
Total fertility rate (children born per woman) |
2.09 |
1.66 |
1.32 |
The society of the
·
Whites, the descendants of
European immigrants (in official categorization, they are often called Caucasians);
·
Blacks or African-Americans, the descendants of slaves forcibly imported from
·
Asians, the descendants of
immigrants from
·
Native Americans, the descendants of the
original inhabitants of
The US Census Bureau distinguishes a fifth race which they call
“Hawaiian and Pacific islander”, but their population
is very small and they mostly live outside the Continental US.
In recent decades, ‘race’ has become a very controversial and
problematic term in the
Most races can be subdivided into
ethnic groups, which are
defined not so much by physical traits but by cultural characteristics, such as
a common language, original homeland, shared religious faith, customs and
traditions, and most importantly, a sense of ethnic identity. There are dozens
of different ethnic groups within the white, the Asian or the Native American
race. Ethnic groups are not identical with nations; there are many ethnic groups
(e.g. the Basques, the Gypsies, or the Kurds) who have no separate country on
their own, but they still have a distinct sense of ethnic identity. Language is
an important defining factor (e.g.
![]() Hungarians usually consider those people fellow Hungarians who can
speak the language) but a common language does not always entail ethnic
identity: Germans and Austrians, Russians and Ukrainians, Serbs and Croats speak
highly similar languages and still think of themselves as different ethnic
groups. The Chinese, on the other hand, speak a variety of very different
regional dialects and still consider themselves part of the same ethnic group.
Jews constitute a unique group since they often speak different languages and
live in different parts of the world but still preserve a sense of ethnic
identity.
Hungarians usually consider those people fellow Hungarians who can
speak the language) but a common language does not always entail ethnic
identity: Germans and Austrians, Russians and Ukrainians, Serbs and Croats speak
highly similar languages and still think of themselves as different ethnic
groups. The Chinese, on the other hand, speak a variety of very different
regional dialects and still consider themselves part of the same ethnic group.
Jews constitute a unique group since they often speak different languages and
live in different parts of the world but still preserve a sense of ethnic
identity.
Out of the major races in the
Another particular group in the modern US are the
Hispanic or
Latino
people, who came to the
Races in the US based
on Census 2000 Data
Population by Race and Hispanic or Latino Origin for the
|
Subject |
Number |
% of Total |
|
RACE |
|
|
|
Total population |
281 421 906 |
100.0 |
|
One race |
274 595 678 |
97.6 |
|
White |
211 460 626 |
75.1 |
|
Black or African American |
34 658 190 |
12.3 |
|
American Indian and |
2 475 956 |
0.9 |
|
Asian |
10 242 998 |
3.6 |
|
Native Hawaiian and Other Pacific
Islander |
398 835 |
0.1 |
|
Some other race |
15 359 073 |
5.5 |
|
Two or more races |
6 826 228 |
2.4 |
|
HISPANIC OR LATINO AND RACE |
|
|
|
Total population |
281 421 906 |
100.0 |
|
Hispanic or Latino (of any race) |
35 305 818 |
12.5 |
|
Not Hispanic or Latino |
246 116 088 |
87.5 |
One of the novelties of the 2000 Census was that people were given the
opportunity to describe their identity by specifying two or more races rather
than only one. As the chart above shows, almost 7 million people (2.4% of the
total
The following chart undertakes a comparison between the figures of the
two last censuses in 2000 and in 1990:
Difference in Population by Race and Hispanic or Latino Origin, for the
|
|
1990 Census |
Census 2000 |
Difference between 1990 and
2000 |
|||
|
Subject |
Number |
% of total |
Number |
% of total |
Numerical difference |
% difference |
|
RACE |
|
|
|
|
|
|
|
Total population |
248 709 873 |
100.0 |
281 421 906 |
100.0 |
32 712 033 |
13.2 |
|
White |
199 686 070 |
80.3 |
211 460 626 |
75.1 |
11 774 556 |
5.9 |
|
Black or African American |
29 986 060 |
12.1 |
34 658 190 |
12.3 |
4 672 130 |
15.6 |
|
American Indian and
|
1 959 234 |
0.8 |
2 475 956 |
0.9 |
516 722 |
26.4 |
|
Asian |
6 908 638 |
2.8 |
10 242 998 |
3.6 |
3 334 360 |
48.3 |
|
Native Hawaiian and Other Pacific Islander
|
365 024 |
0.1 |
398 835 |
0.1 |
33 811 |
9.3 |
|
Some other race |
9 804 847 |
3.9 |
15 359 073 |
5.5 |
5 554 226 |
56.6 |
|
HISPANIC OR LATINO AND RACE |
|
|
|
|
|
|
|
Total population |
248 709 873 |
100.0 |
281 421 906 |
100.0 |
32 712 033 |
13.2 |
|
Hispanic or Latino (of any race) |
22 354 059 |
9.0 |
35 305 818 |
12.5 |
12 951 759 |
57.9 |
|
Not Hispanic or Latino |
226 355 814 |
91.0 |
246 116 088 |
87.5 |
19 760 274 |
8.7 |
Note: The race figures of 1990 and 2000 Census are
not directly comparable, since in 1990 people did not have an opportunity to
specify two or more races. In the chart above, the replies in 2000 coming under
the heading of “Two or more
races” were therefore omitted.
This chart reveals, among other things, that the two fastest-growing
groups are Hispanics and Asians: in merely 10 years, the number of Hispanics
grew by more than 50%, while that of Asians almost by 50%. In contrast, the
number of Whites increased by merely 6%, and the increase of Blacks was also
significantly lower, about 16%. If present population trends continue, White
Americans will cease to constitute the majority by about 2050 (their proportion
will fall below 50%), and there will no longer be a racial “majority” in the
These national figures do not indicate how the various groups are
represented in the individual states, cities, or communities. As might be
expected, they are not evenly distributed across the nation. In Mississippi, for example, African Americans make
up about 36 percent of that state’s population, whereas in Wyoming or Utah they represent less than 1 percent. In the
nation’s capital,
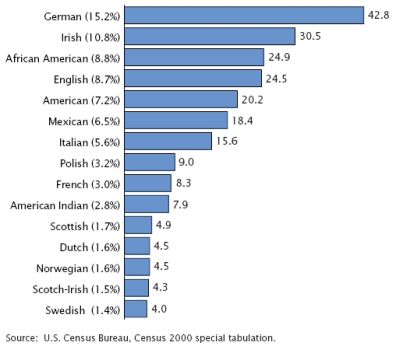 Largest ancestry groups |
Since 1980, the census no longer asks people about where their parents
were born, but asks more general questions about their “ancestry” (“What is this person’s ancestry or ethnic origin?”) and
lets people decide for themselves. In 2000, about 80% of the respondents
specified at least one ancestry, and 22% of them specified two ancestry groups. In the chart, there is a list of the
most often selected ancestry groups, showing how many millions of Americans
identified with each, with their proportion within the overall population in
brackets.
It would be a mistake, however, to suppose that all these people necessarily feel a strong emotional attachment to their national or ethnic origins. The 5th largest group is American, chosen by over 20 million people, which obviously means that these respondents did not have any particular ethnic identity. English, the 4th largest group chosen by almost 25 million people, also suggests a very generic identity since the majority of English immigrants came to the US in colonial times. All in all, the total number of people choosing a specific European ethnic origin significantly declined from 1990, while the number of people choosing African-American, Hispanic, Latino, or various Asian ancestries increased. All this suggests that distinct ethnic identities are slowly declining among non-Hispanic whites, while the identity of non-white groups (Hispanics and Asians) remains strong.
White Americans still constitute the largest racial group within
American society with more than 200 million people in 2000, and their absolute
number has been growing steadily all through the 20th century, but
their proportion within the overall population has declined from 87% in 1970 to
75% in 2000. This is due to two main reasons: the lower birth rate among white
families and the low level of white immigration in recent decades. After the
Immigration Act of 1924 introduced national-origin quotas for European
immigrants (see History of immigration),
mass white immigration was significantly restricted, and it was surpassed by
Asian and Latin American immigration after World War II, which changed racial
proportions considerably. The low level of recent European immigration to the
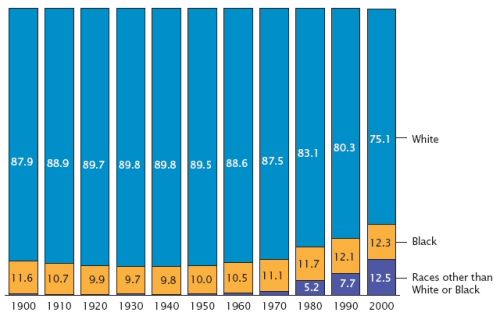 Distribution of total population by race 1900 - 2000 |
Within the country, the proportion of the white population is the
highest in rural states of the northern regions of the
On the whole, the white American population has become more homogeneous
by the end of the 20th century. Even though millions of white people
register a wide range of ancestries on their census forms, they have far more
distant connections to these ethnic groups and their cultures than their parents
or grandparents had. The great majority of them are second-, third-, or
fourth-generation immigrants, which means that they speak no other language than
English and the ethnic traditions do not play an important role in their life.
Simply speaking, they are far more American than German, Irish, Italian, Polish
etc. in their cultural attitudes, not to mention the fact that many of them have
a mixed ancestry. Their ancestry is largely an interesting curiosity for them or
a romantic attachment to a faraway country they do not know much about.
The “Americanization” of white Americans has also reduced or
obliterated the cultural differences that once created a lot of distrust and
hatred among various white ethnic groups. Catholic and Jewish whites have been
accepted as equal members of society, and Anti-Catholicism or Anti-Semitism
plays very little role in contemporary American public life. Perhaps the only
ethnic and/or religious group that is regarded with considerable suspicion are Arab and Muslim Americans, which is an unfortunate but
logical consequence of the September 11, 2001
terrorist attacks.
According to the 2000 Census, blacks make up slightly more than 12% of
society, with almost 35 million people. If one adds the number of those who
listed ‘Black’ as one of their racial identities, the figure is close to 13%, or
over 36 million people (since American society has traditionally considered
people with mixed racial ancestry ‘black’, the higher figure is perhaps more
relevant). This proportion is slightly higher than during most of the 20th
century, but not significantly: in 1900, blacks already made up 11% of American
society. The slight increase is due partly to the higher than average birth rate
of African-American families, and partly to the immigration of blacks from
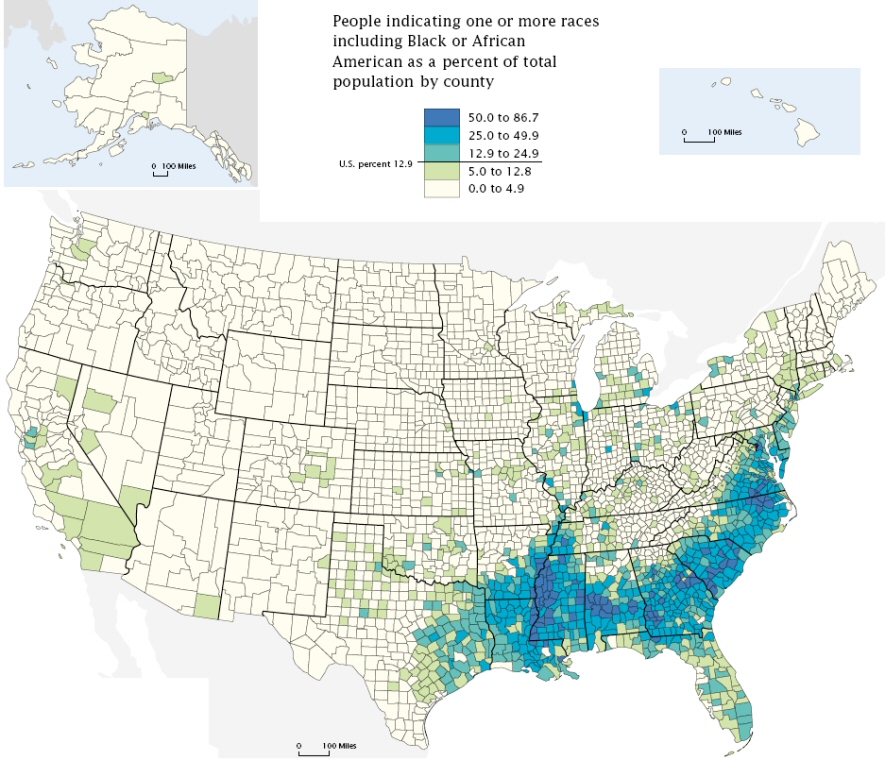
More than half of all African-Americans still live in the South. Blacks make up the largest minority in
former slave-owning states, for example 36% in Mississippi, 33% in Louisiana, 30% in South Carolina, 29% in Georgia and 26% in Alabama, but their proportion is over 15% in all
Southern states. Outside the South, they are concentrated mostly in the inner
cities of metropolitan areas. Out of major US cities, African-Americans
constitute more than 60% of the population in
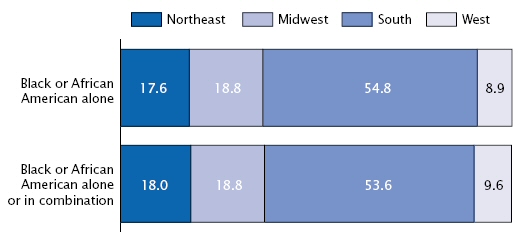 Percent distribution of African-Americans by region |
It is a common mistake of
![]() Hungarian students to lump blacks together with other non-white racial
minorities who have immigrated to the
Hungarian students to lump blacks together with other non-white racial
minorities who have immigrated to the
How is it possible then that such an old
minority is still considered disadvantaged in modern American society? The main
reason is the centuries of slavery and racial discrimination by the white
majority. The
Civil War
(1861‑1865), the most devastating war in the history of the
Despite these constitutional changes, most blacks remained poor and
uneducated, and official discrimination against them continued in all Southern
states. One form of discrimination was
racial segregation, or the physical separation of people of different
races. Until the 1950s and 1960s, Blacks were not allowed into many public
places such as restaurants, hotels, theaters, and schools. There were separate
railway carriages, buses, restrooms and facilities marked “colored only” for
blacks, and they could be arrested and jailed if they entered places reserved
for whites. Such state laws that maintained and enforced racial segregation were
popularly called
Jim Crow laws. This practice was
legalized by the Supreme Court in 1896 in in the
Plessy v. Ferguson
case when the Court ruled that racial segregation was legal as long as "separate but equal" facilities
were provided. The landmark case
Brown v. the Board of Education
in 1954 was the first successful challenge to legalized segregation of blacks
and whites. The Supreme Court unanimously ruled that maintaining separate but
equal schools for blacks and whites was unconstitutional because separate
schools can never provide the same educational opportunities (see Landmark cases).
There were other forms of racial discrimination: most Southern states
had laws which were intended to prevent Blacks from voting at elections (e.g.
they were required to pass difficult
literacy tests or had to pay a certain
amount of
poll tax which many
poor blacks could not afford). Most rural Blacks had no land on their own, therefore they usually worked as sharecroppers .
Others had low-paid manual jobs in the cities (e.g. factory workers, household
servants etc.). The better-paid and more respectable jobs were unavailable to
them partly because they lacked the necessary skills and education, and partly
because whites refused to work under a black boss. Because of the hopelessness
of their situation, from the early 20th century more and more blacks,
especially young males, decided to flee from the South and look for
opportunities in the large industrial cities of the East Coast, the
The social and political situation of African-Americans changed
dramatically as a result of the
civil rights movement.
The movement was a national campaign by African-Americans in the 1950s and 60s
to achieve equal civil rights for Blacks in American society: they wanted to put
an end to segregation, demanded fair housing, equal employment opportunities,
and fair voting laws for Blacks. The movement used the methods of nonviolent
resistance and demonstrations. Until his assassination in 1968, Baptist minister
Martin Luther King, Jr. (1929‑68)
provided leadership and strategy for the mass movement. He followed the example
of the passive resistance of
Mahatma Gandhi during the independence
movement in India, and supported nonviolent tactics such as peaceful
demonstrations, protest marches, boycotts of segregated facilities (e.g.
public transportation where Blacks had to sit at the back), and "sit-ins" at restaurants where Blacks
were not allowed. He was convinced that Blacks can achieve their purposes best
if they draw the nations’ attention to the injustice of their social situation.
He consistently called whites “brothers”, and, despite numerous threats and
attacks against him, he urged blacks to reject violence which would only incite
hatred between races. Perhaps his most famous public appearance was in 1963, at
the historic
March on Washington D.C., where he
delivered his
“I have a dream” speech,
a moving expression of his faith in universal human brotherhood. (For an audio
recording of the speech,
click here) He was murdered by a racist white
man in
Other, more radical black leaders advocated violent revolution against
the “white man’s society”. Perhaps the most famous of these black leaders was
Malcolm X (1925–65), who was involved
in the Nation of Islam
movement (also called Black Muslims),
which urged blacks to convert to a peculiar form of Islam as a way to reject
Christianity forced on them by white slave-owners. Malcolm X (who dropped his
original surname because it was given to his ancestors after their white
slave-owner) also publicly urged blacks to violent self-defense. In 1964,
however, he broke with the Black Muslims, and began to preach peace between
races. He was murdered by his former comrades in
The civil rights movement achieved important legal successes in the
1960s. Between 1963 and 1965, Congress prohibited the use of a poll tax and
literacy tests in federal elections. The most important law was the
Civil Rights
Act of 1964, which forbade the administration of voting laws in a discriminatory
manner, prohibited discrimination in public accommodations such as restaurants
and hotels and also outlawed job discrimination by employers and unions. As a
result of these new laws, voter registration among blacks has significantly
increased (although the percentage is still well below the similar figure for
Whites). More and more Blacks have been elected to public office, for example
mayors of large cities, or Representatives in federal Congress.
There were other, more controversial laws and governmeaznt policies in
the 1960s that were meant to eliminate or compensate for discrimination. In the
area of employment, the government has tried to correct job discrimination
through
affirmative action programs. The term
itself comes from legal language and it means something like ‘positive action’
to correct wrongdoings of the past. The government programs under that name
require government employers (e.g. federal agencies) and encourage private ones
to hire and promote more blacks, women, and members of other disadvantaged
groups who had been given fewer opportunities in the past. The ideal purpose of
affirmative action was that the proportion of blacks and women in important
position (e.g. in government offices, among college graduates, university
professors, among business leaders etc.) should approach their overall
proportion in society. Supporters of the policy insist that some form of preferential treatment is necessary to
compensate for historical disadvantages and also to to break down the negative
prejudices and long-standing discrimination against minorities and women in the
job market. Critics of affirmative action condemn it as a form of reverse discrimination against white
males, whereas the correct purpose of such a program should be
non-discrimination against any social group.
Affirmative action programs have been repeatedly attacked in federal
courts concerning their constitutionality, and the Supreme Court has passed
several decisions about such cases. The Court has declared fixed
quotas (e.g. a certain number of college
places or jobs reserved exclusively for disadvantaged groups) unconstitutional,
but did not reject the principle of affirmative action, ruling that race and
gender may legally be “taken into account” in the selection applicants.
There are also heated debates about the impact of affirmative action on
the social advancement of blacks. There is no doubt that the social situation of
blacks has significantly improved since the 1960s. More blacks have attained
middle-class jobs, more hold elected political
positions, more own their homes, more live in the suburbs. Improved educational
opportunities have been a key factor in these changes In 1960 the proportion of
high school graduates was only half as much among blacks as among whites, and by
2000 this difference has been reduced to 72% among blacks versus 84% among
whites. But the disadvantages still show among college graduates: only 14% of
Blacks have college degree as opposed to 26% of Whites (part of the reason
probably is that blacks cannot afford the high tuition in higher education; for
details, see
Life in College and University).
The disparities continue remain wide in income and employment. The
median income of blacks was only about two-thirds (c. $30,400) of the national
median income (c. $44,500) and hardly more than 60% of the median income of
non-Hispanic whites (c. $49,100) in 2002-2004. As a result of the income
differences, almost 25% of all blacks lived below the official poverty line,
about twice the national figure (12.7%) and three times the proportion among
non-Hispanic whites (8.6%).
Part of the reason for poverty is the lack of stable black families.
More than two-thirds of all black children are born to unmarried mothers, and
one-third of all single mothers in the
According to the 2000 census data, the total number of Hispanics has
passed 35 million, which means 12.5 percent of the total
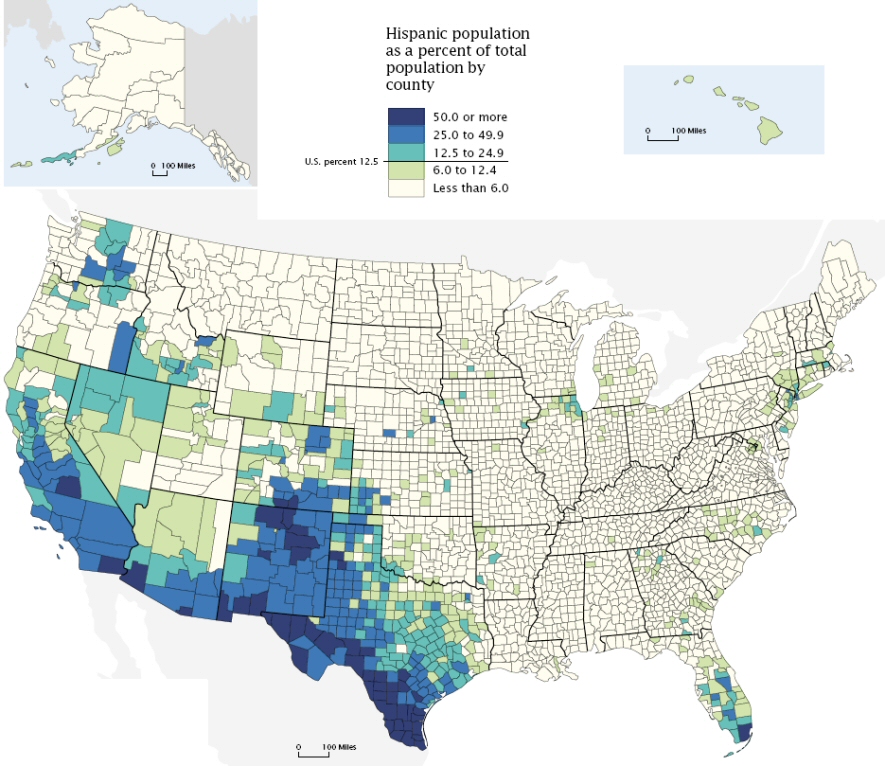
Hispanics have a long history in the Southwestern region of the
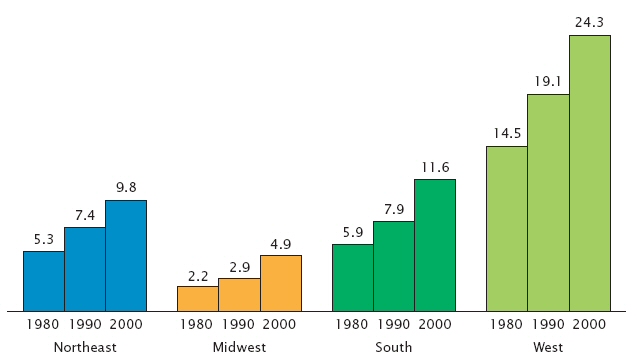 Percent distribution of Hispanics by region 1980-2000 |
The proportion of Hispanics remained insignificant in the
The largest group among Hispanics is the Mexican-Americans (formerly called Chicanos, but it is considered an
offensive term nowadays). Many of them come illegally, crossing the long and
mostly deserted U.S.-Mexican border at night. These illegal alienswork on farms at harvest time, on construction
sites, as household servants, janitors, or in other hard and menial physical
jobs Americans avoid. Mexican-Americans are concentrated along the Mexican
border: they make up one-third of the population of California (that means about 11 million people)
and Texas (almost 7 million), while in sparsely
populated New Mexico, they constitute 42% of the state’s 1.8 million people.
Among all the legal Hispanic residents of the
Another significant source country for Hispanic immigrants is
Another easily distinguishable group are the Cuban-Americans, who mostly live in
southern Florida, primarily in
The regional distribution of Hispanics is very uneven. California, Texas, New York, and Florida together account for two-thirds of the
total Hispanic population of the
As it can be seen from these data, Hispanics are concentrated in urban
areas, especially in central cities, where, similarly to blacks, they tend to
form ethnic neighborhoods, also called ’barrios’.
These areas face similar problems to those of black inner-city neighborhoods:
bad, decaying houses, poor schools, few job opportunities, and high crime rates.
More than 40% of Hispanics have no high school diploma, while the same figure
among whites is only 15%, and only 10% have earned a Bachelor’s degree in
college, compared to 26% of whites. The school problems of Hispanic children are
increased by the fact that their mother tongue is not English (more than 70% of
Hispanic children speak Spanish at home), therefore
they face serious difficulties in basic communication tasks.
They also tend to make much less money than the society average: their
median income was $34,300 in 2002-2004, higher than blacks but much lower than
whites. Two and a half times as many (22%) Hispanic families live under the
official poverty line than the figure among whites (9%).
The increase of Hispanic immigration during the last 40 years has had a
dramatic impact on American society, particularly in the Southwest where the
greatest settlement has occurred. Spanish has become a major language in
In 2000, Asian-Americans made up more than 4 percent of the
American population, with about 12 million people (including those who reported
Asian as one of their racial identities). Their number has grown by almost 50%
since 1990, which suggests a high level of immigration from
The history of Asian-American immigration to the
The greatest concentration of Asian-Americans can be found
in the West Coast: they make up 12% of the population of California, which means over 4 million people.
The collective term “Asian-American” hides a huge ethnic
variety within this category, since each of the above groups speaks different
languages, and has different cultural traditions. Perhaps the only common
feature among Asians is their determination to fit into and succeed in American
society: although there are Asian ethnic neighborhoods, especially along the
West Coast, where the majority of them have settled, they are far less
characteristic than similar Hispanic communities. Asians work hard to master the
language, start independent businesses, run shops and restaurants, and encourage
their children to speak perfect English and excel at school. Asians have been
very successful in education: 44% of them had a college degree in 2000, compared
to 26% of whites. On the whole, the majority of Asians have integrated into the
American middle class far more successfully than either blacks or Hispanics,
which is an interesting illustration of how different cultural backgrounds
determine the social success of different immigrant groups who otherwise all
started out as poor and disadvantaged people in the
In the 2000 census, about 2.5 million people were identified as
American Indian tribal members (American Indian, Eskimo, and Aleut), while
another 1.6 million identified Indian as one of their racial identities. Even in
combination, these two groups represent only 1.5% percent of the entire
The great majority of Native Americans live in the West, where most of
their reservations are located. None of them is forced to stay on a reservation
any more, and an increasing number decide to move to larger metropolitan areas
in search of jobs and careers. Only 10 percent of the Indian reservations have
5,000 or more Indians. The largest is the Navajo reservation which covers some
16 million acres in Arizona, New Mexico, and Utah, and has about 135,000 members living on
it. The largest proportion of Native Americans is found in sparsely populated Alaska, where they constitute more than 19
percent. In only five other states – New Mexico, South Dakota, Oklahoma, Montana, and Arizona – do Indians make up more than 5 per
cent of the population. In terms of absolute numbers,
the largest Native American populations live in California, Oklahoma and Arizona.
The last of the Native American groups in the West were forced into
reservations after 1876 (see History of Immigration),
and they were not allowed to leave their assigned territories. They were unable
to continue their traditional nomadic lifestyle, and they lived in great poverty
under federal government control, dependent on the food provisions of the
federal
Bureau of Indian Affairs. The government made efforts to assimilate the
Indians to white
After World War II, the federal government encouraged Indians to move
into urban areas as an indirect policy of assimilation. Young Native Americans
who lived in cities observed the success the civil right movement of blacks,
founded the
American Indian Movement
(AIM) in 1968 to encourage Native American cultural identity and draw
attentionto the past injustices suffered by Indians as well as their present
poverty and social problems. They demanded reforms that would give political
autonomy to Native American groups and recognize their special cultural needs.
Between 1969 and 1973, Indian activists organized several demonstrations to
capture public attention (e.g. they occupied
affirmative action
African-American
American Indian
ancestry
Asian
Baptist
barrio
Black
boycott
Caucasian
census
civil rights movement
to commute
Cuban-Americans
Deep South
ethnic group
ghetto
Hawaiian and Pacific islander
illegal alien / illegal immigrant
immigrant
Jim Crow laws
Malcolm X
Martin Luther King Jr.
Megalopolis
metropolitan area
Mexican-American
Native American
one-drop rule
plantation, plantation agriculture
preferential treatment
protest march
Puerto Rican
quota system
race
racial discrimination
refugee
reverse discrimination
rural
to secede
sharecroppers
sit-ins
suburb, suburban, suburbanization
U.S. Census Bureau
urbanization
White